Composite Scores
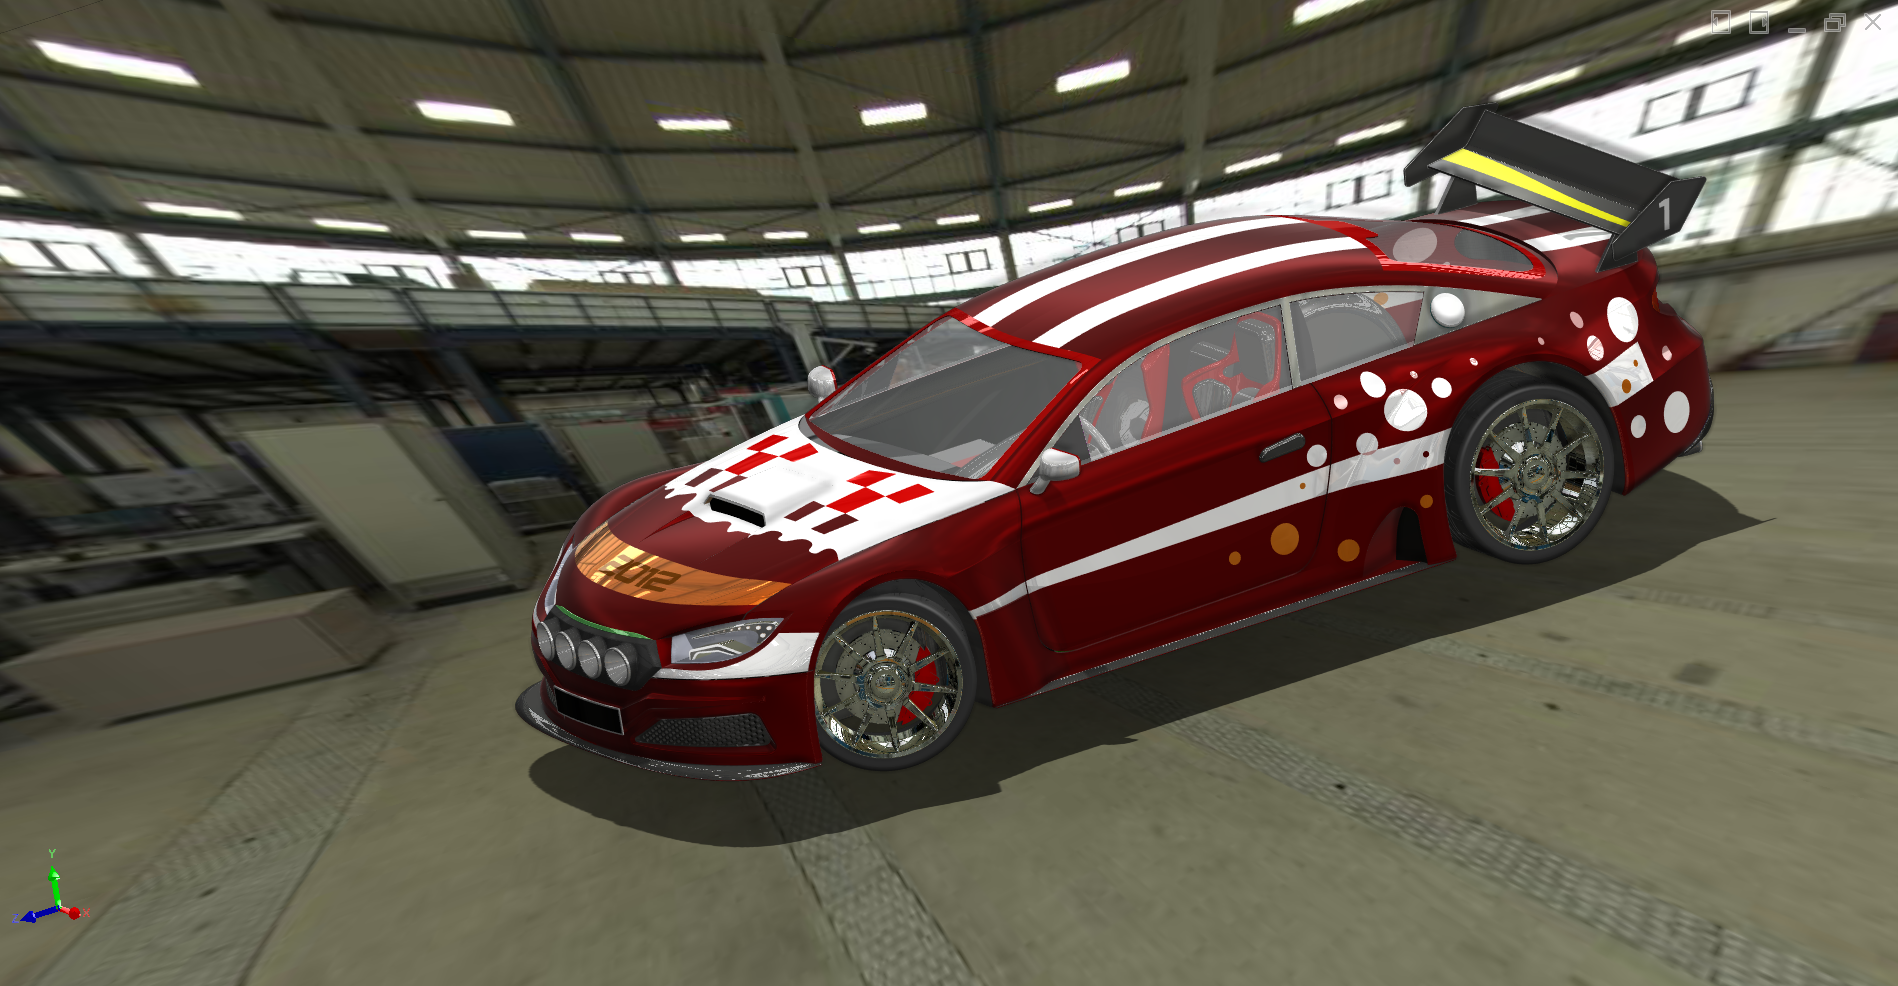
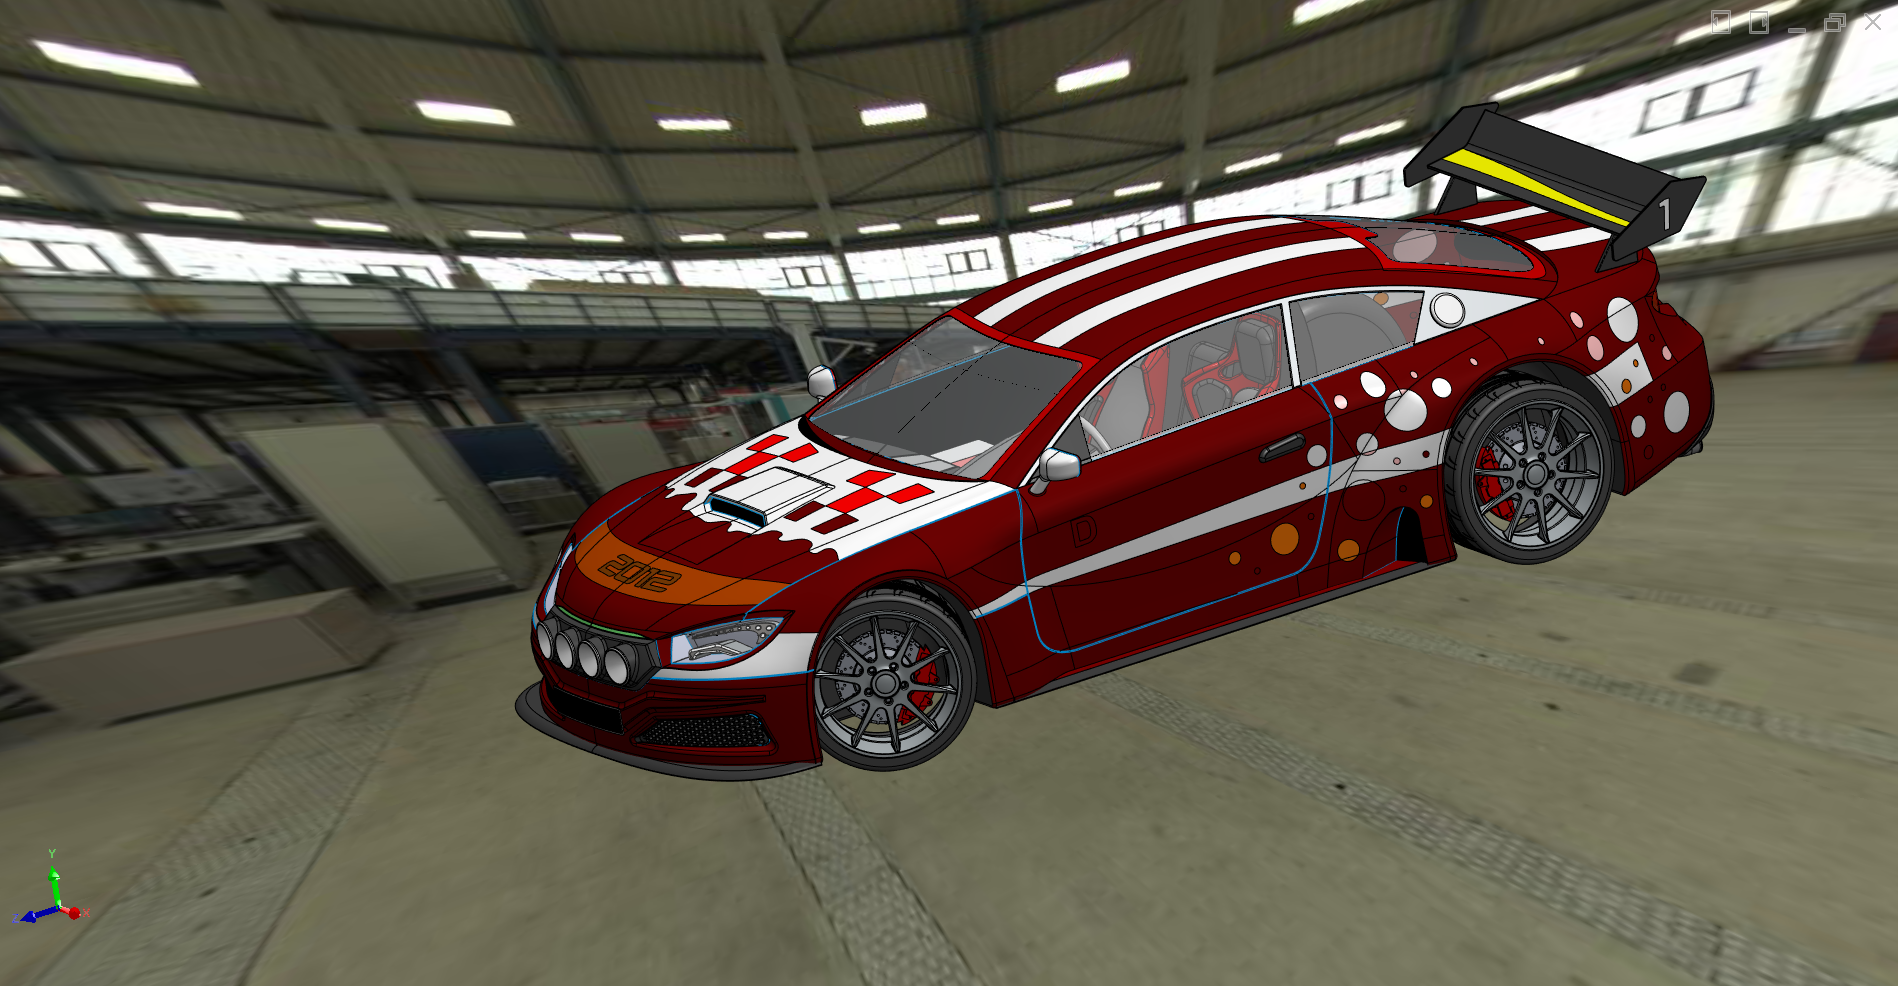
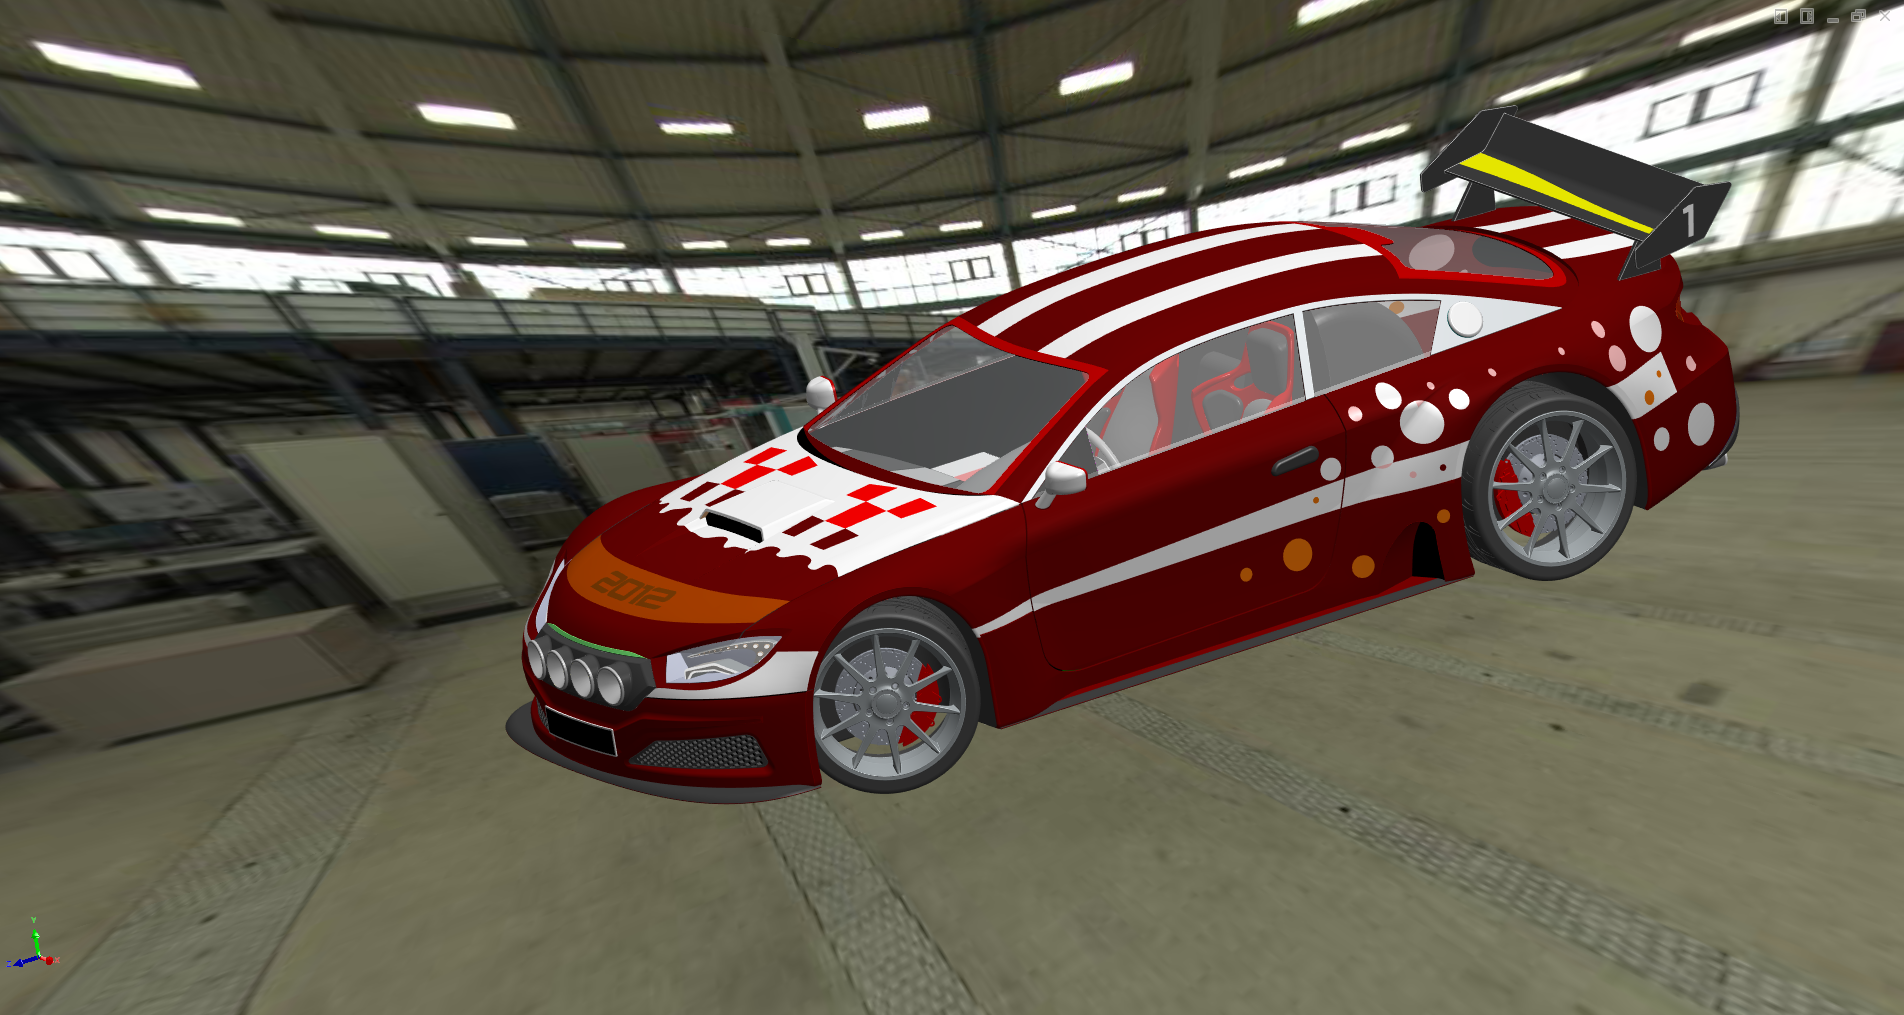
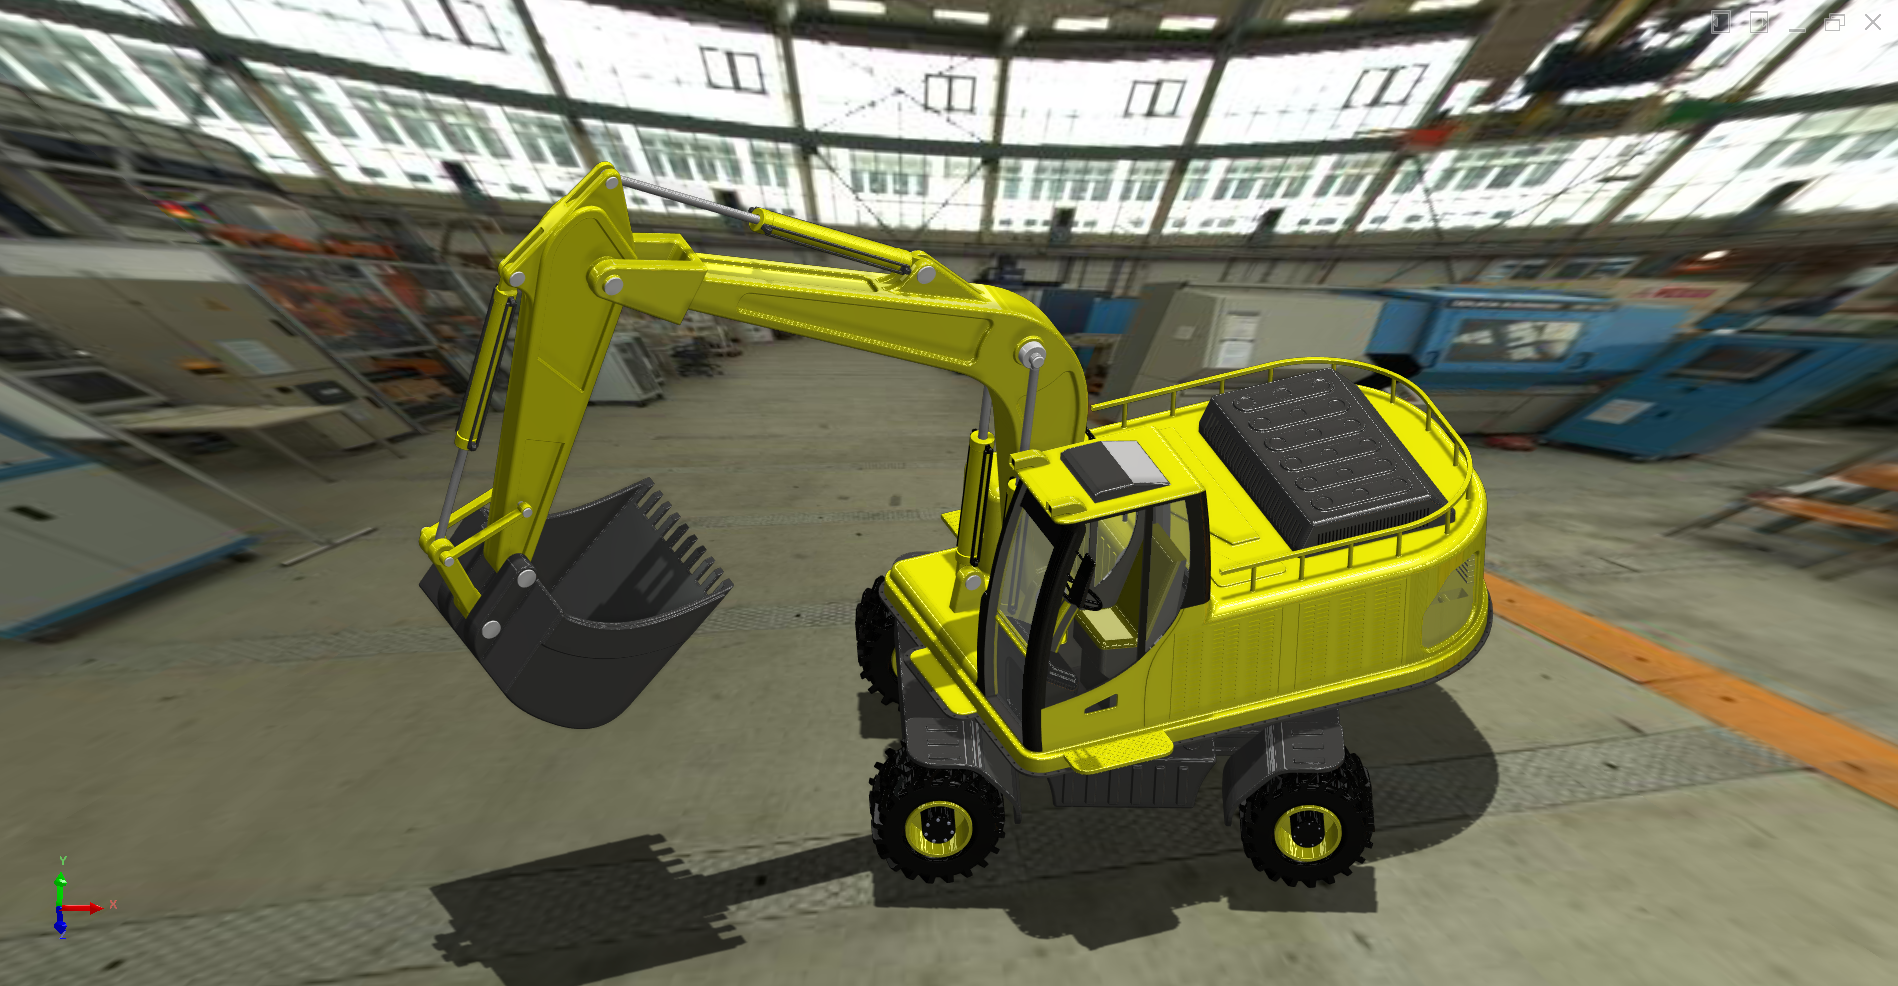
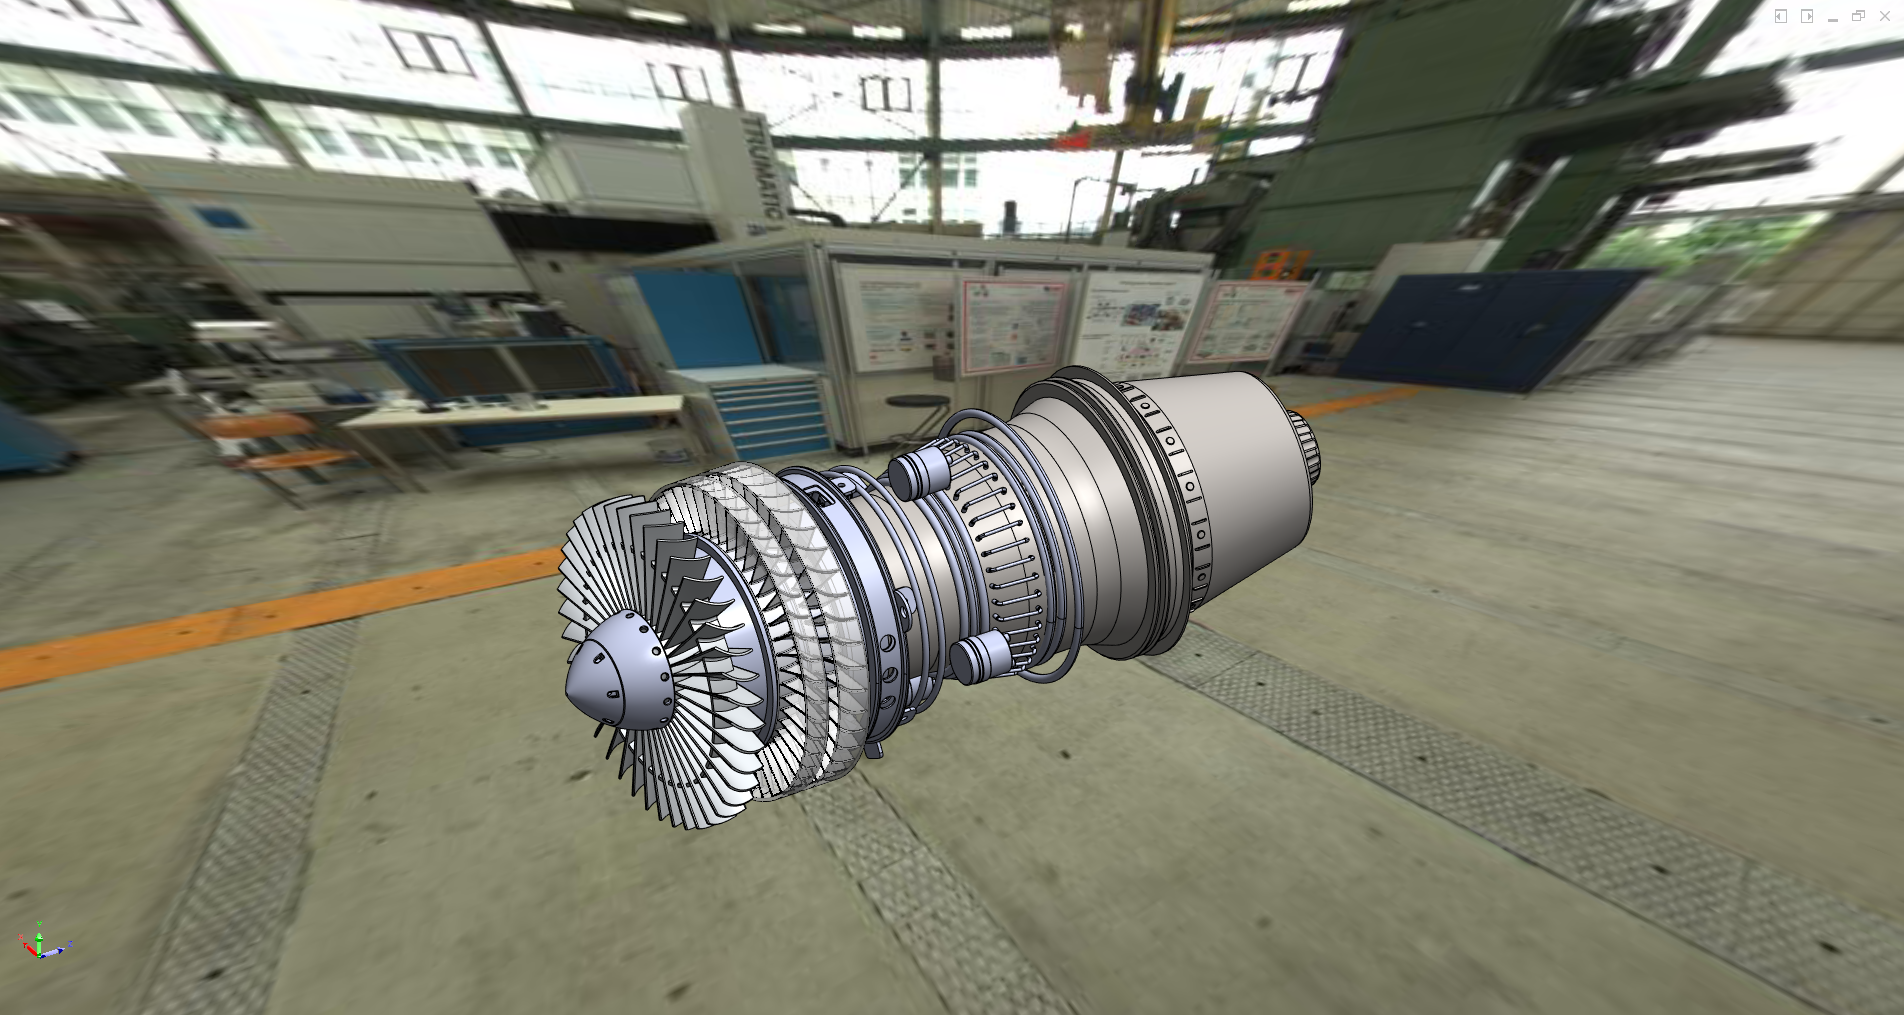
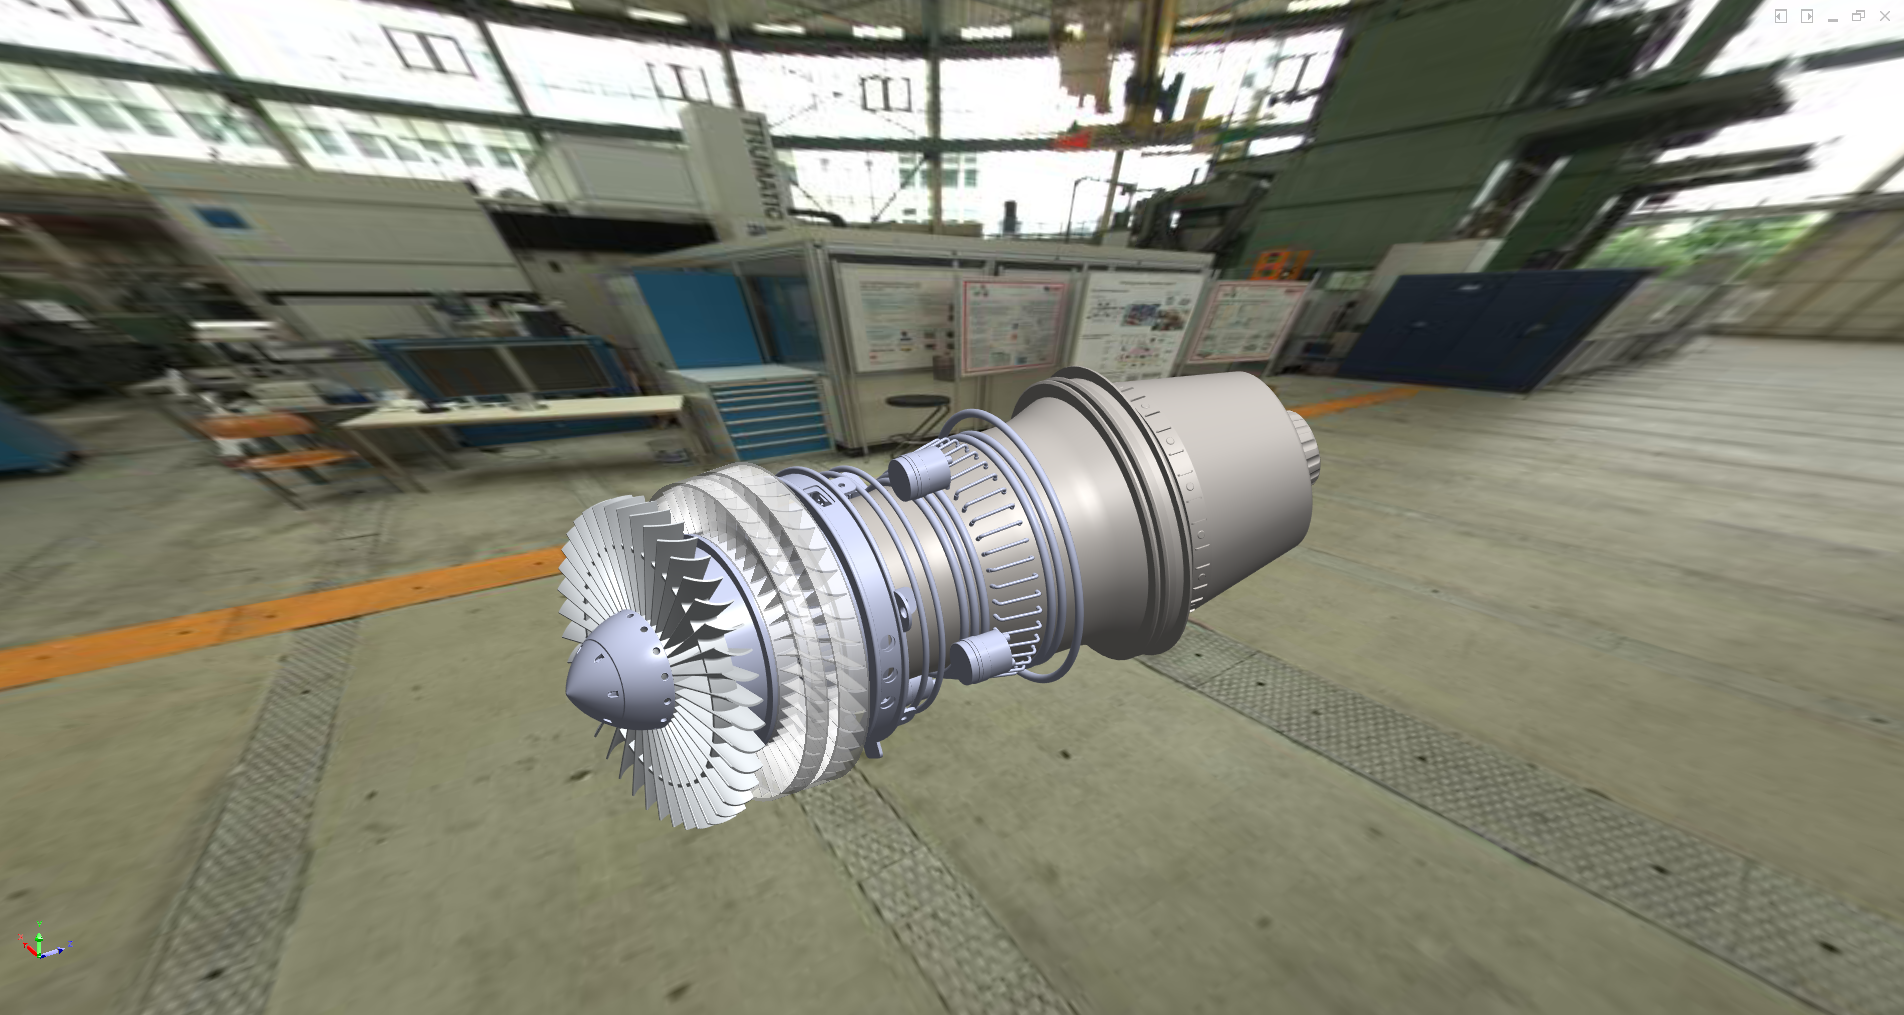
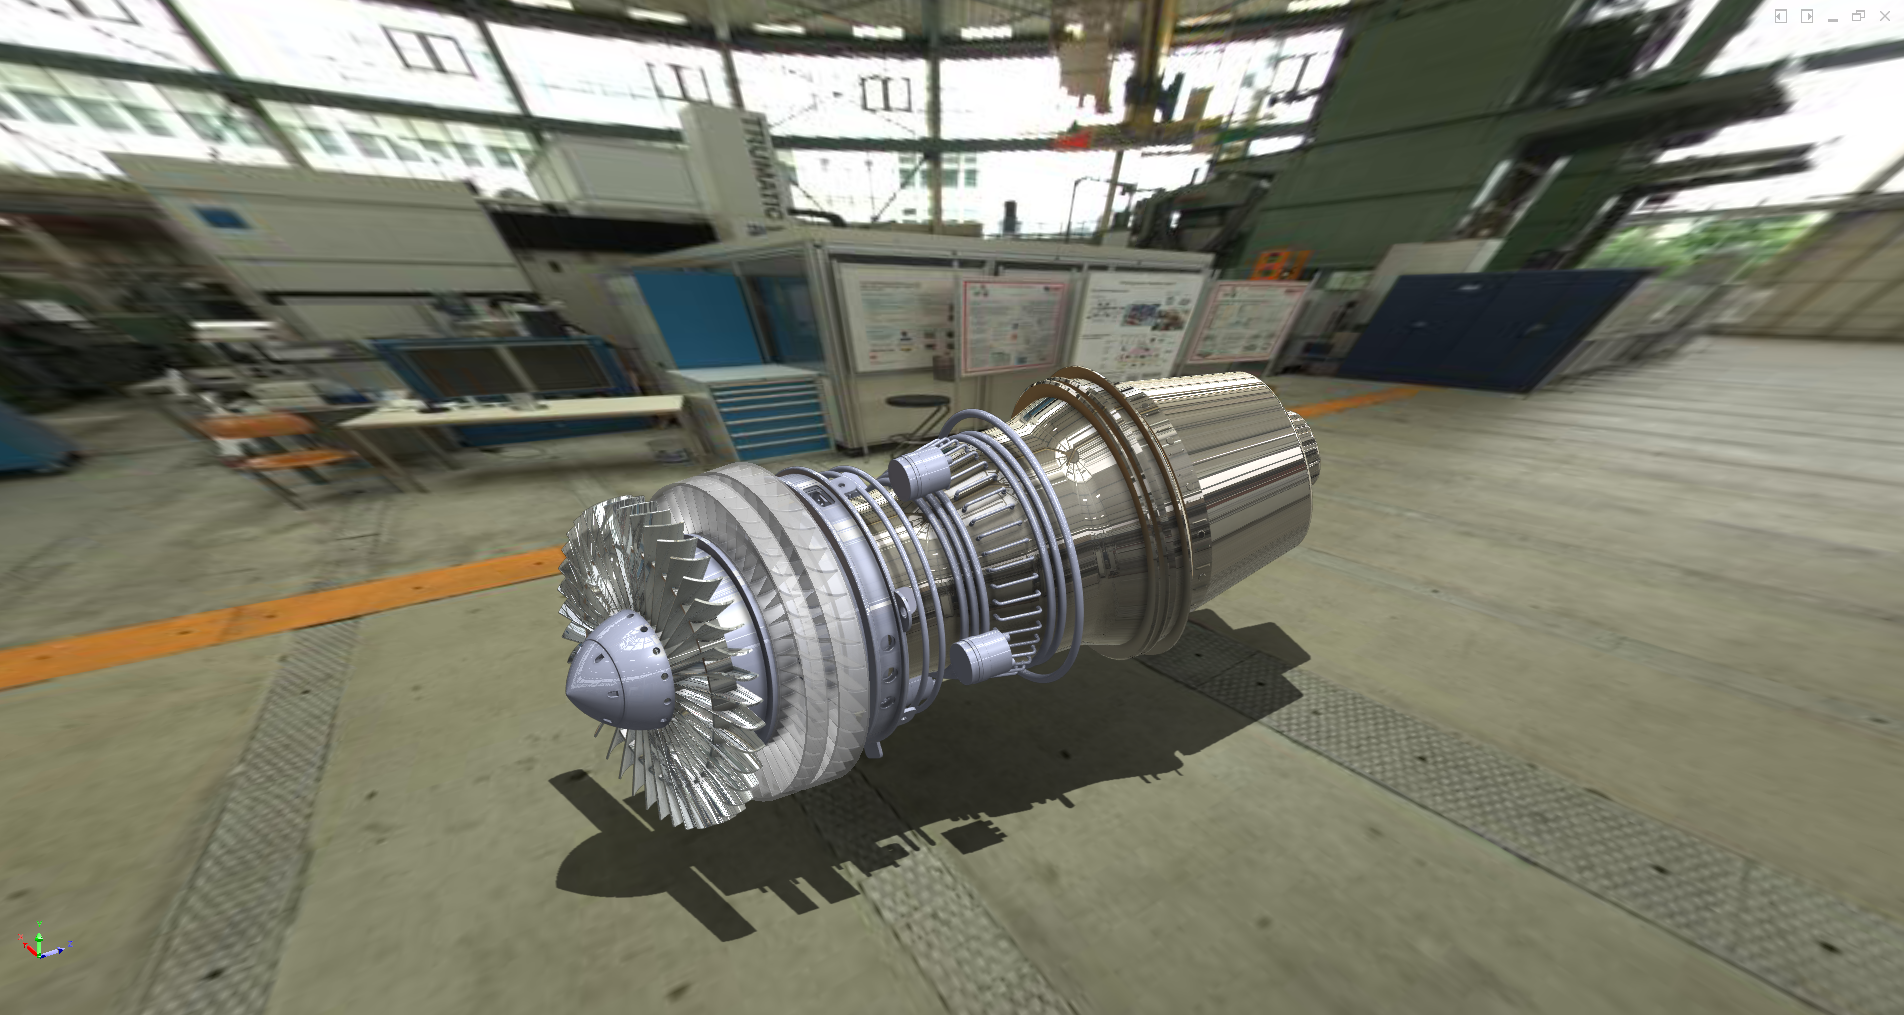
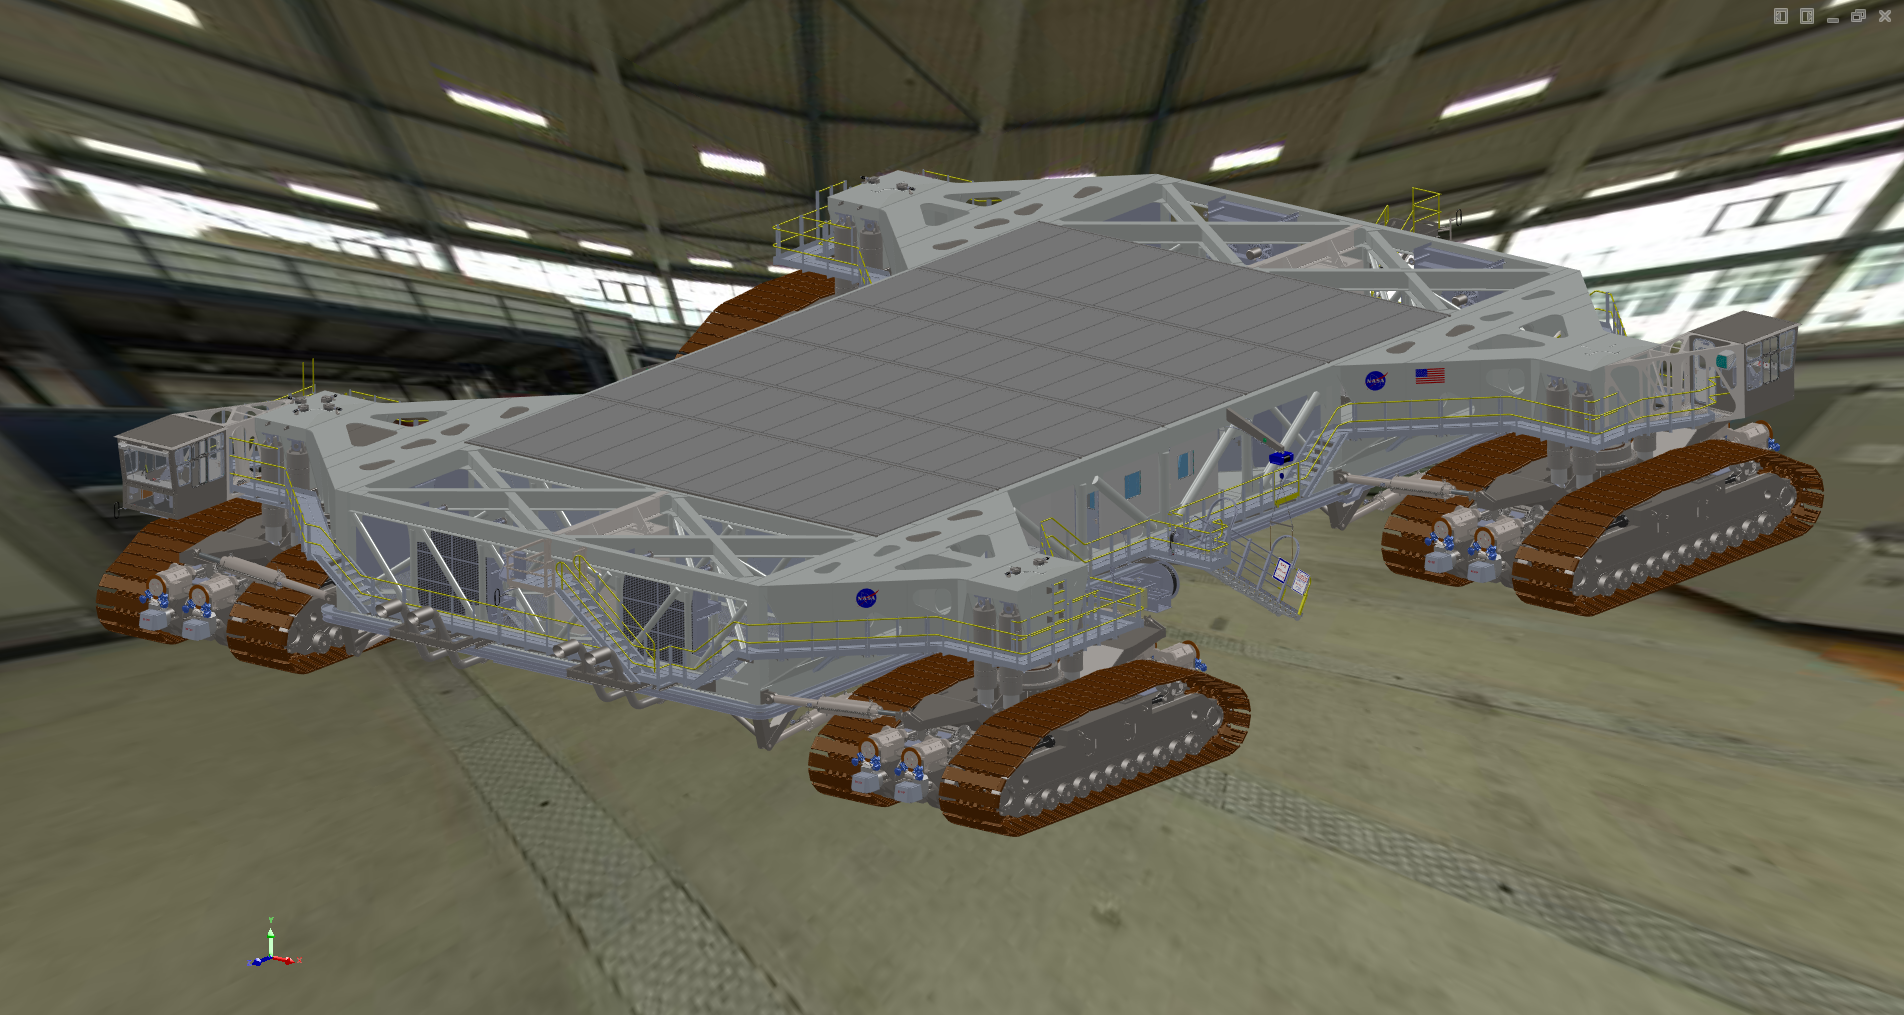
SPECviewperf measures the frame rate, or frames per second (FPS), at which your graphics card can render scenes across a wide variety of applications and usage models. Each viewset represents an application or a usage model, and each composite score below is based on a weighted geometric mean of many different scenes and rendering modes.
Composites by Viewset
To explore a viewset in more detail, including the measured frame rate for each test of which the composite score is comprised, click on the viewset name in the menu to the left.
| Viewset | Composite Score | Window |
|---|---|---|
| 3dsmax-07 | 205.53 | 1900 x 1060 |
| catia-06 | 155.11 | 1900 x 1060 |
| creo-03 | 202.65 | 1900 x 1060 |
| energy-03 | 123.68 | 1900 x 1060 |
| maya-06 | 573.07 | 1900 x 1060 |
| medical-03 | 91.47 | 1900 x 1060 |
| snx-04 | 613.02 | 1900 x 1060 |
| solidworks-07 | 372.63 | 1904 x 1060 |
Benchmark Information
| Benchmark | ||
|---|---|---|
| Name | SPECviewperf® 2020 Benchmark | |
| Version | 2020.3.0 | |
| Submission | ||
| Test Date | Fri May 06 2022 15:20:08 GMT-0500 (Central Daylight Time) | |
| Submission Candidate | Yes | |
| Submitting Company | Dell, Inc. | |
| Comments | Vsync disabled; graphics driver: https://www.nvidia.com/content/DriverDownload-March2009/confirmation.php?url=/Windows/Quadro_Certified/512.59/512.59-quadro-rtx-desktop-notebook-win10-win11-64bit-international-dch-whql.exe&lang=us&type=Quadro | |
System Configuration
| Workstation | ||
|---|---|---|
| Manufacturer | Dell Inc. | |
| Model | Precision 3660 | |
| BIOS Name | 1.2.38 | |
| Manufacturer | Dell Inc. | |
| Serial Number | 3660303 | |
| Version | DELL - 2 | |
| SMBIOS Version | 1.2.38 | |
| OS Name | Microsoft Windows 10 Pro | |
| Build Number | 19044 | |
| Graphics | ||
| Name | NVIDIA RTX A6000 | |
| Driver Version | 30.0.15.1259 | |
| Resolution | 1920 x 1080 | |
| Name | Intel(R) UHD Graphics 770 | |
| Driver Version | 30.0.101.1002 | |
| Resolution | 1920 x 1080 | |
| DPI | 96 (Scale Factor: 100%) | |
| Processor | ||
| Name | 12th Gen Intel(R) Core(TM) i9-12900K | |
| Address Width | 64-bit | |
| Nominal Clock Speed | 3200 MHz | |
| Number Of Cores | 16 | |
| Number Of Logical Processors | 24 | |
| Memory | ||
| DIMM Name | Physical Memory | |
| Memory Speed | 4800 MHz | |
| Memory Capacity | 32 GB | |
| DIMM Name | Physical Memory | |
| Memory Speed | 4800 MHz | |
| Memory Capacity | 32 GB | |
| Disk Drives | ||
| Drive Model | NVMe PM9A1 NVMe Samsung 1024GB | |
| Drive Capacity | 953.86 GB | |
| Drive Model | TOSHIBA DT01ACA100 | |
| Drive Capacity | 931.51 GB | |
| Display | ||
| Generic PnP Monitor | 1920 x 1080 | |
| Default Monitor | 1920 x 1080 | |
3dsmax-07
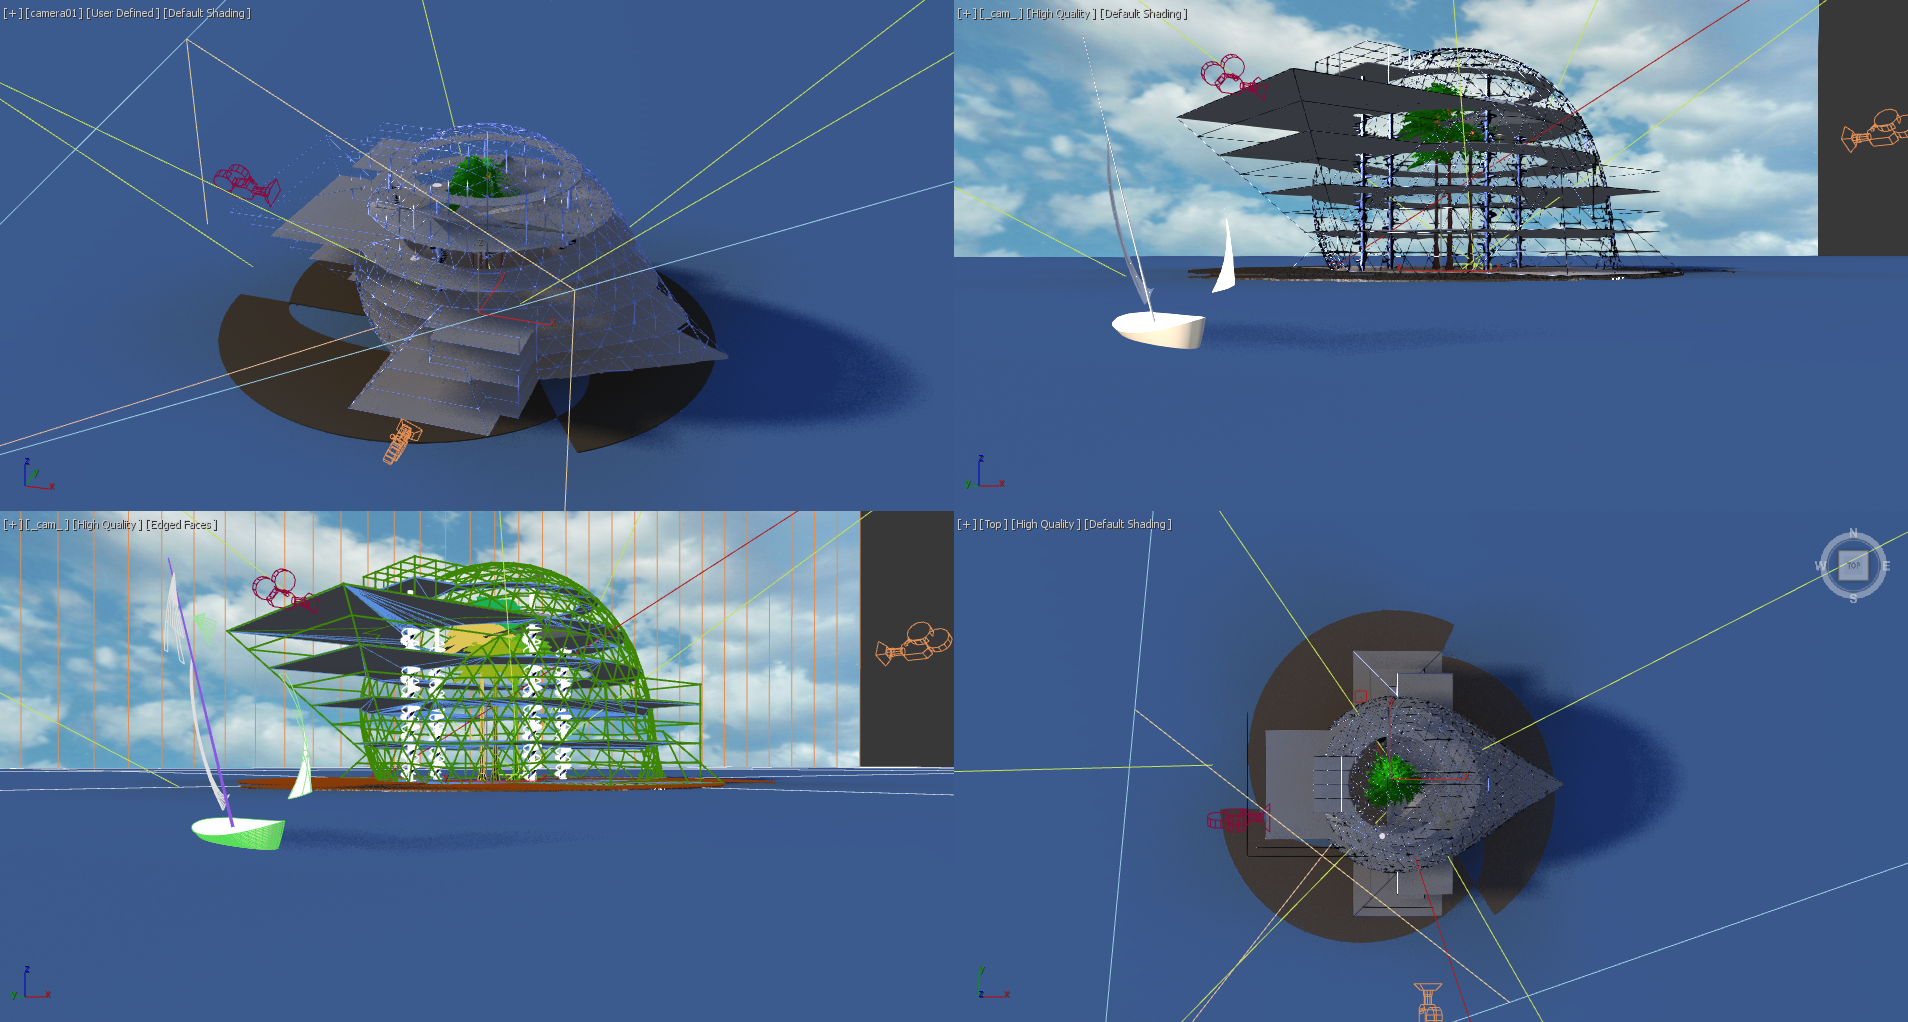
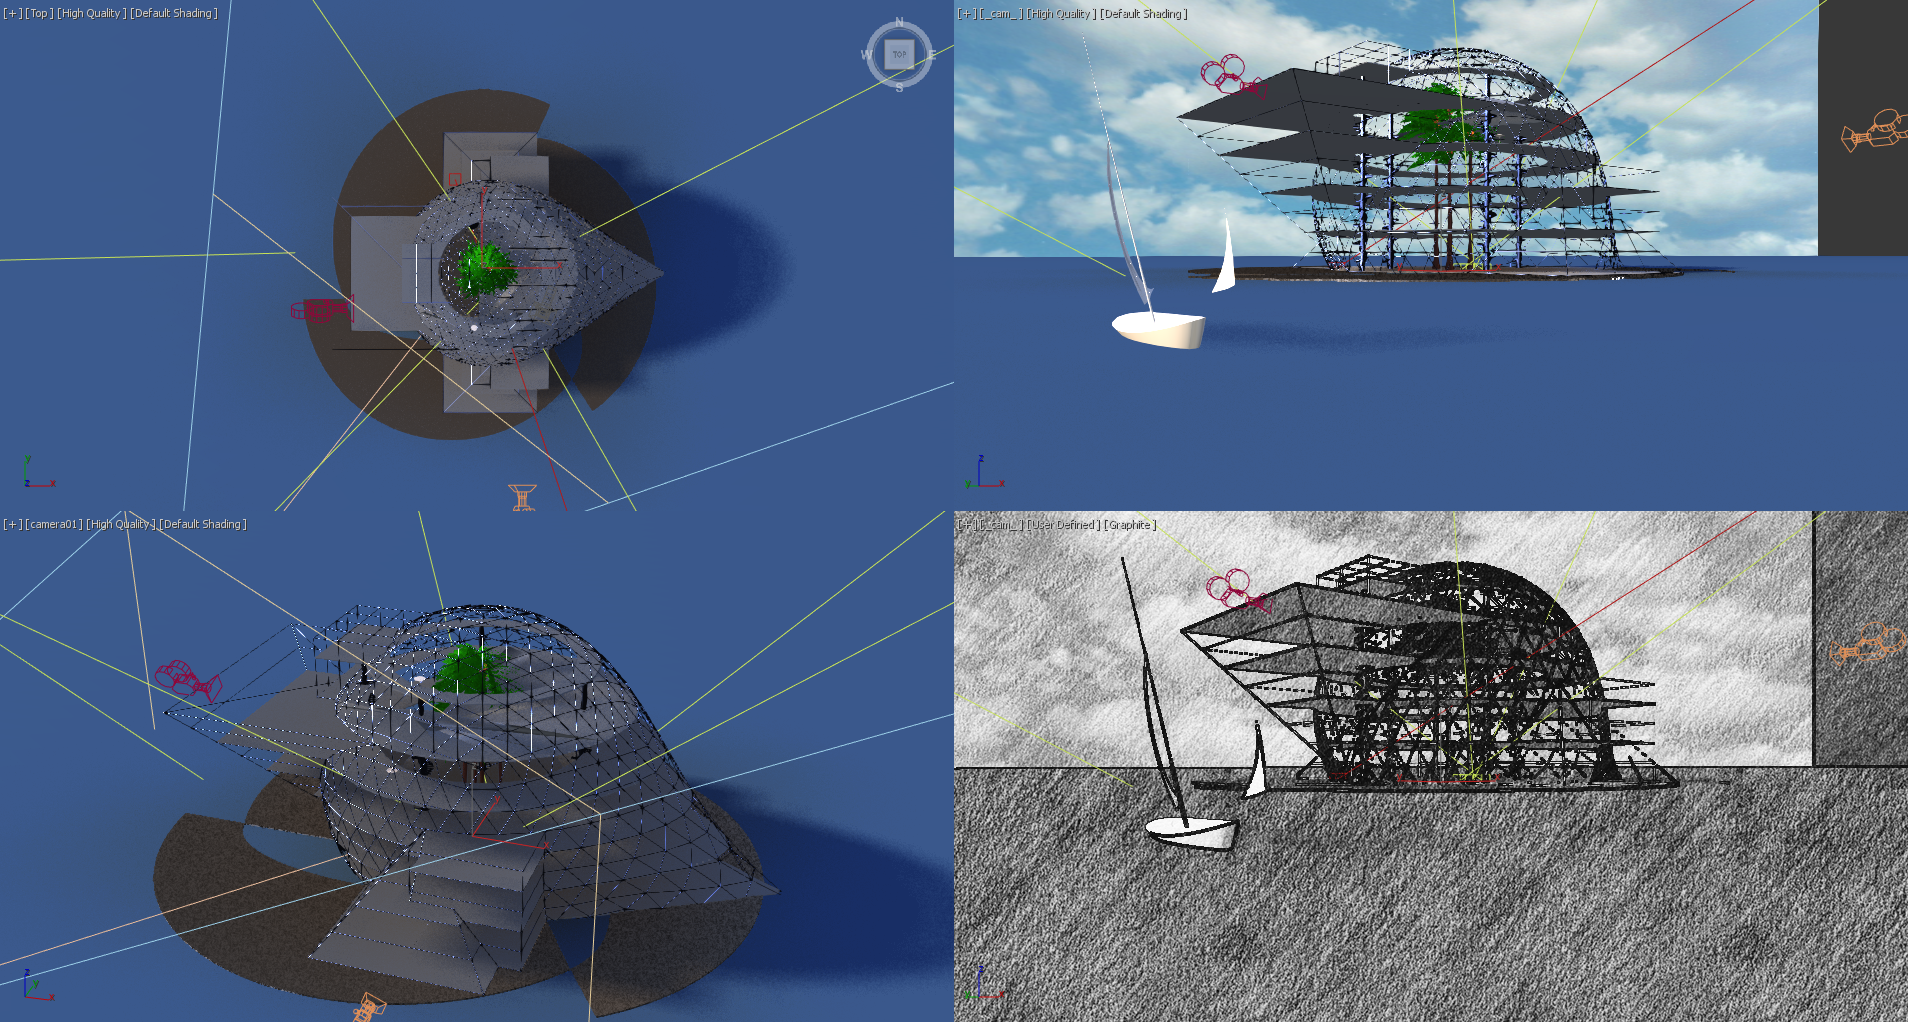
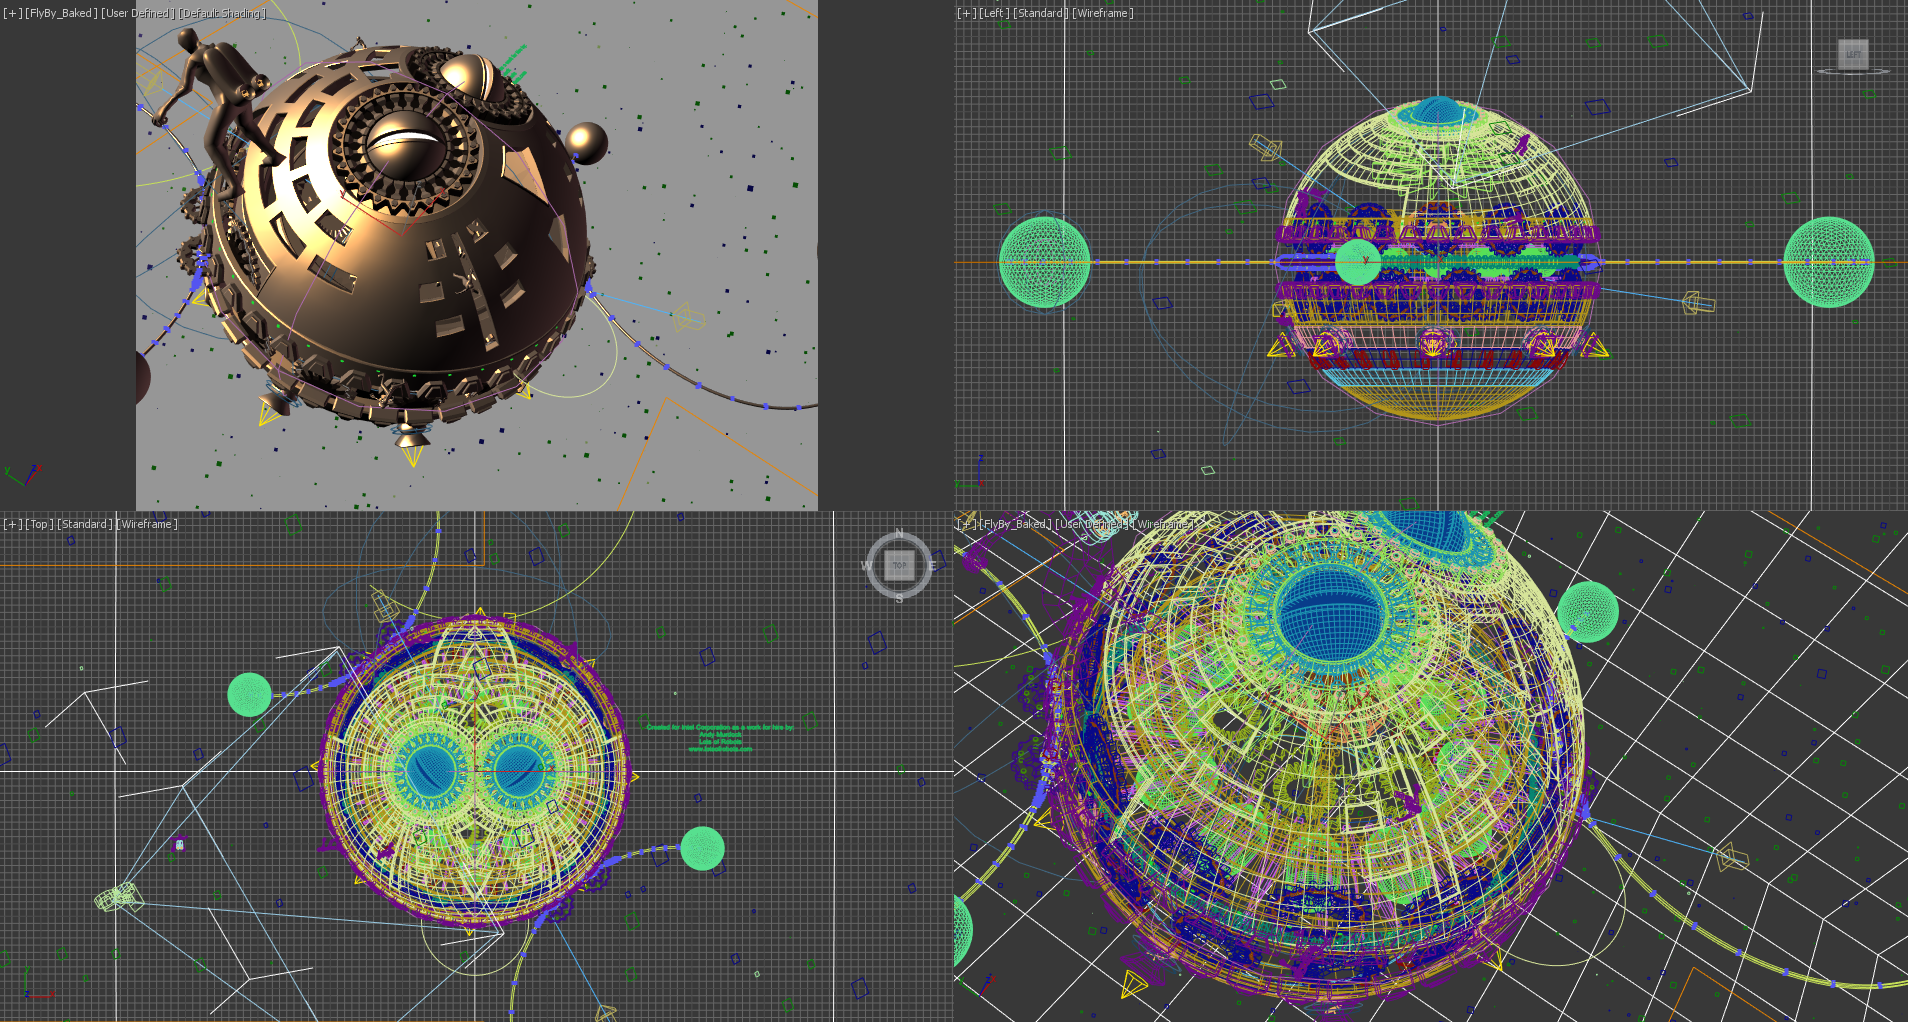
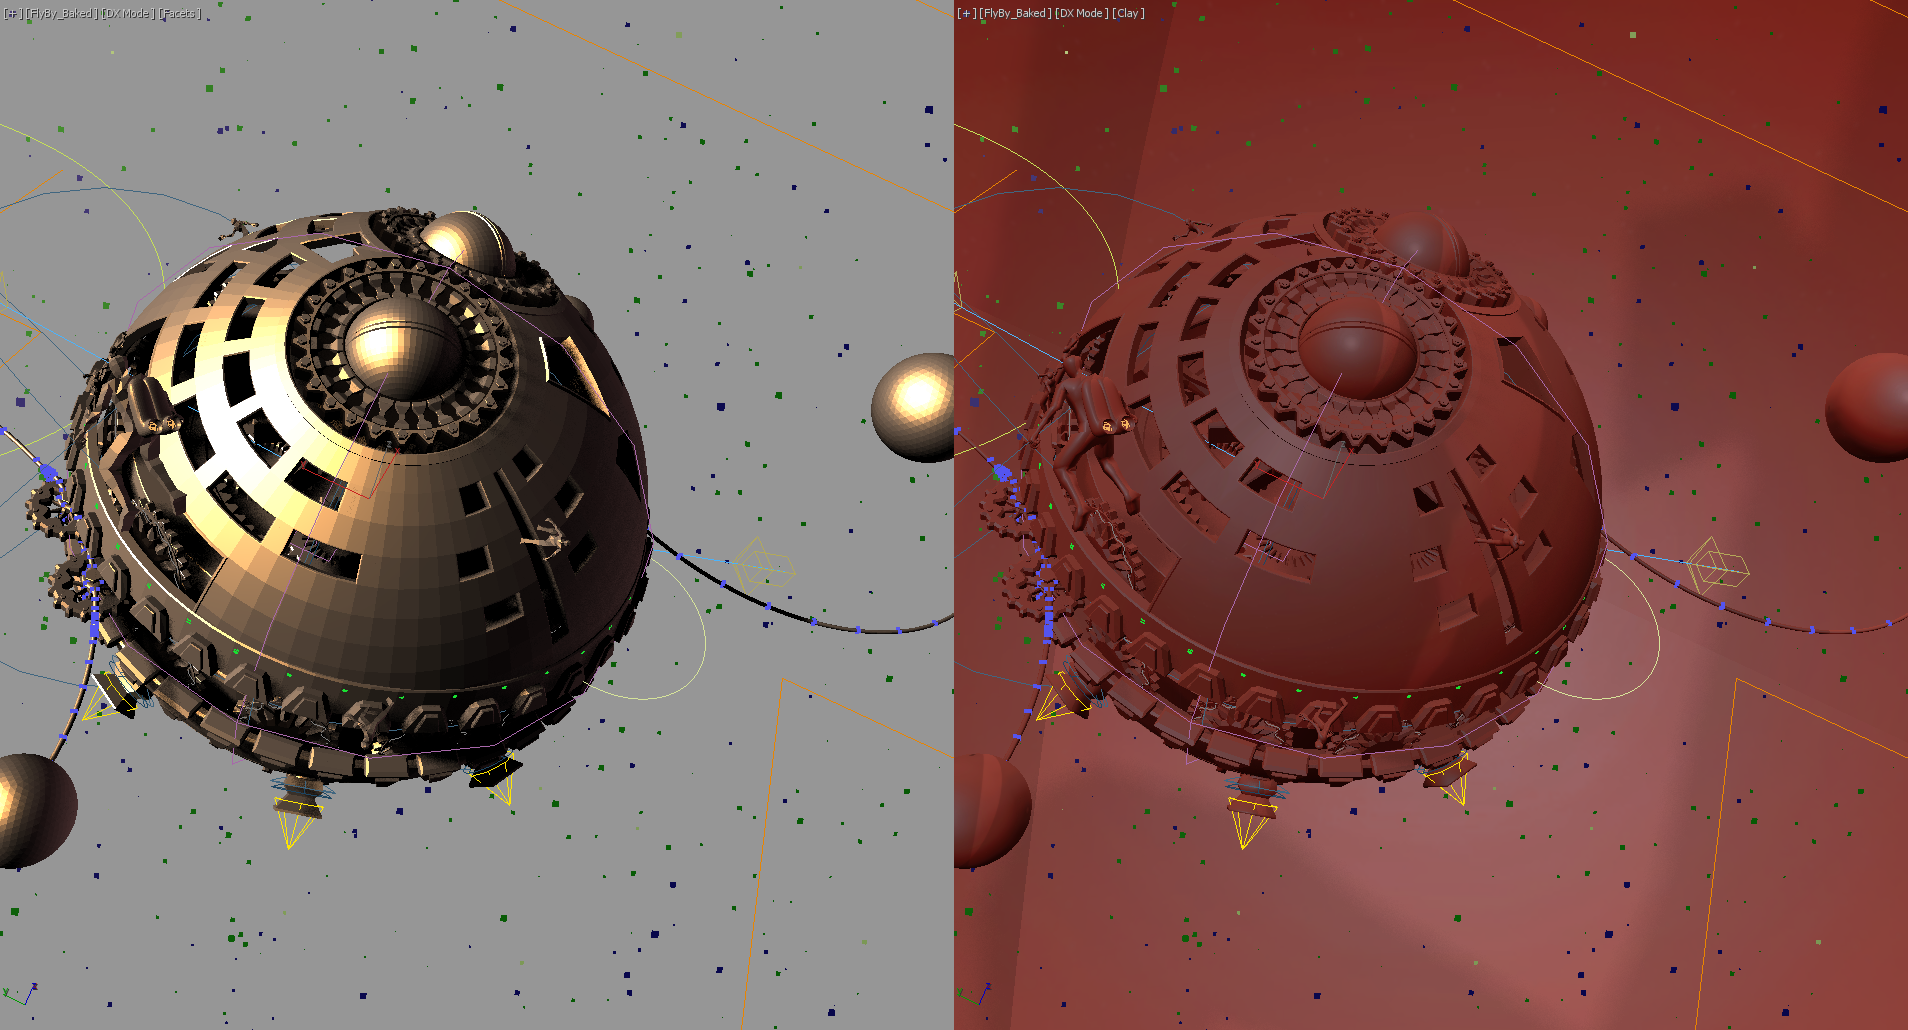
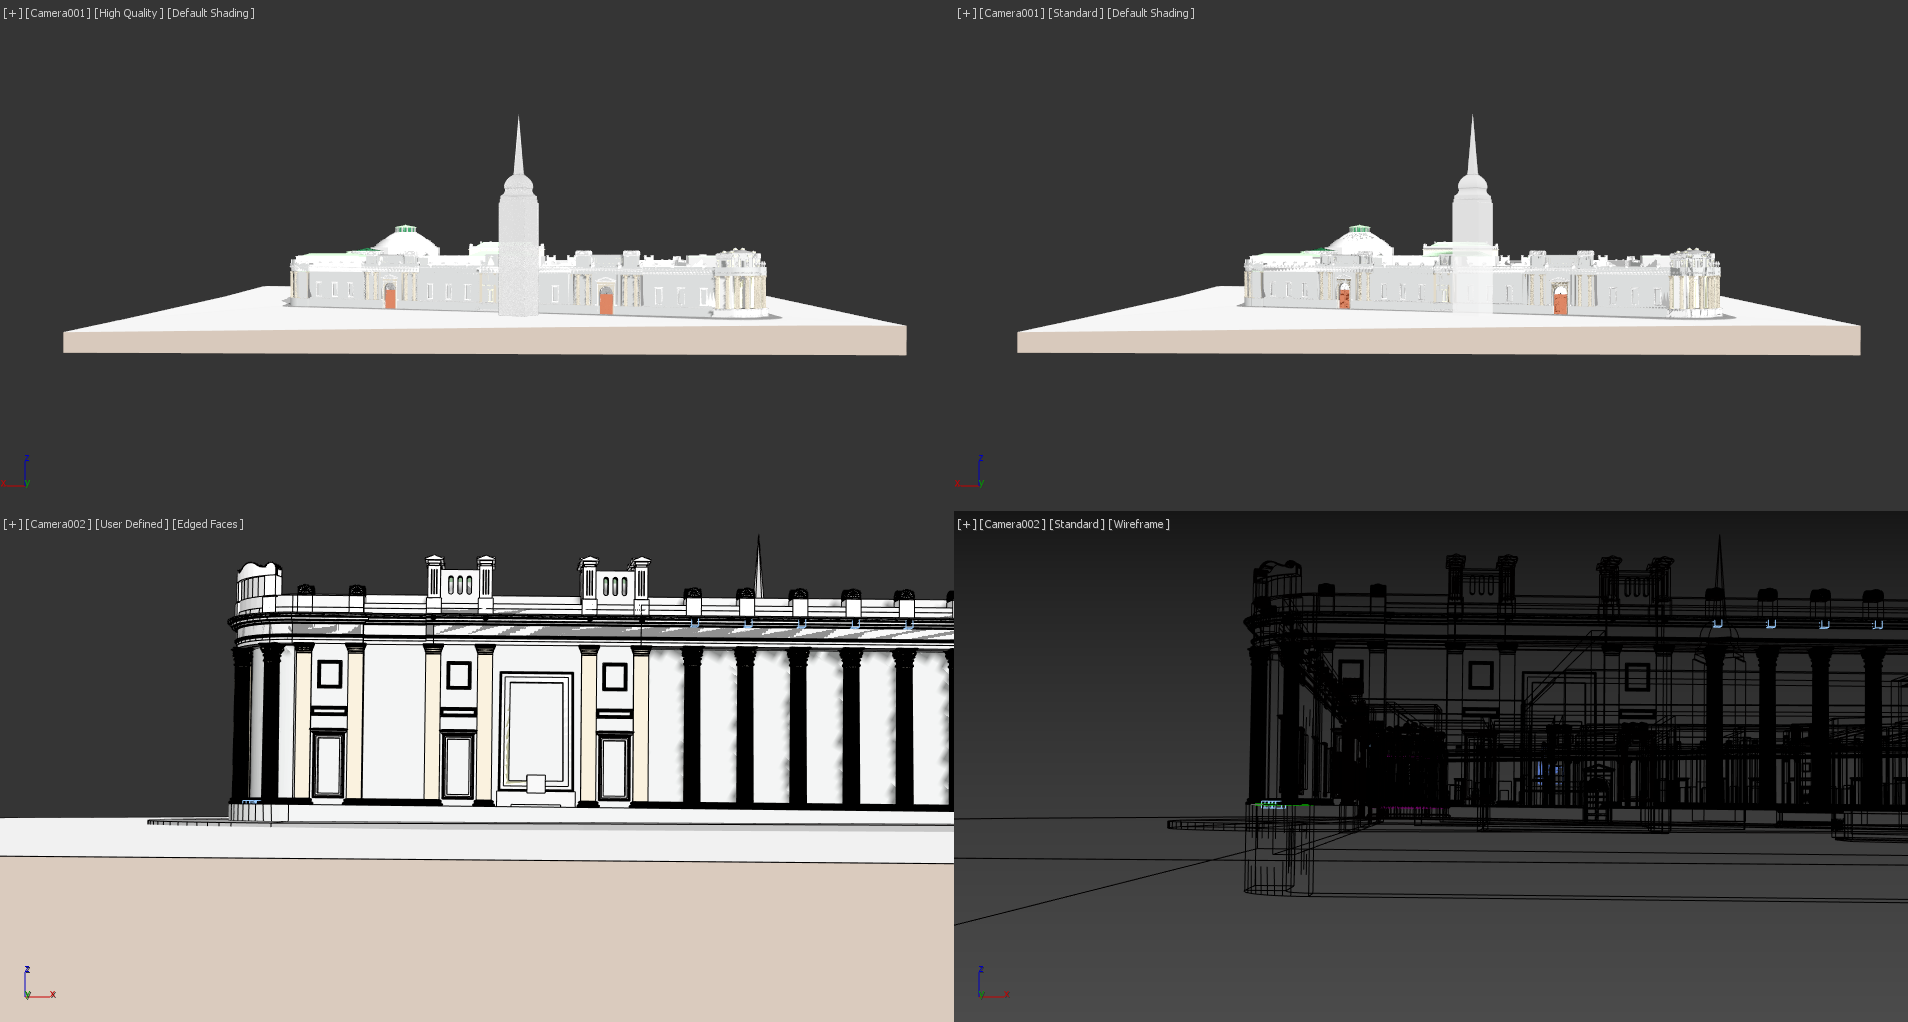
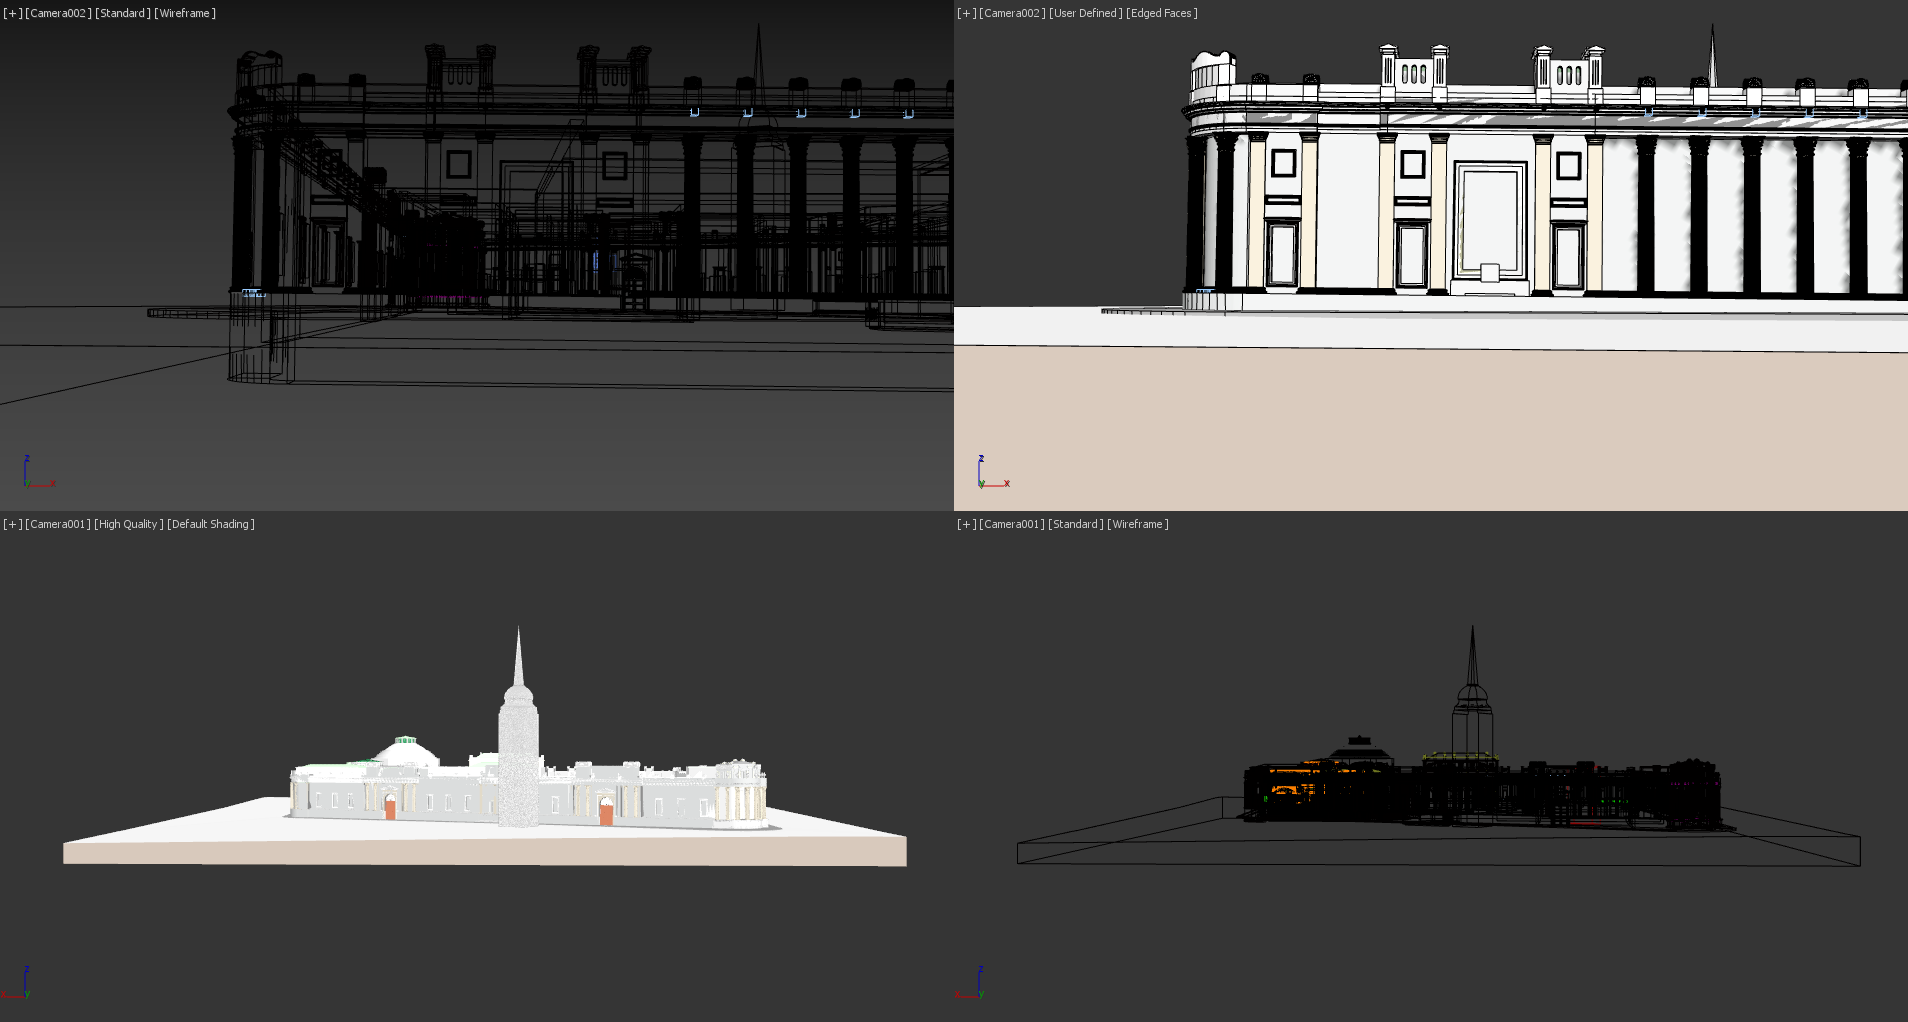
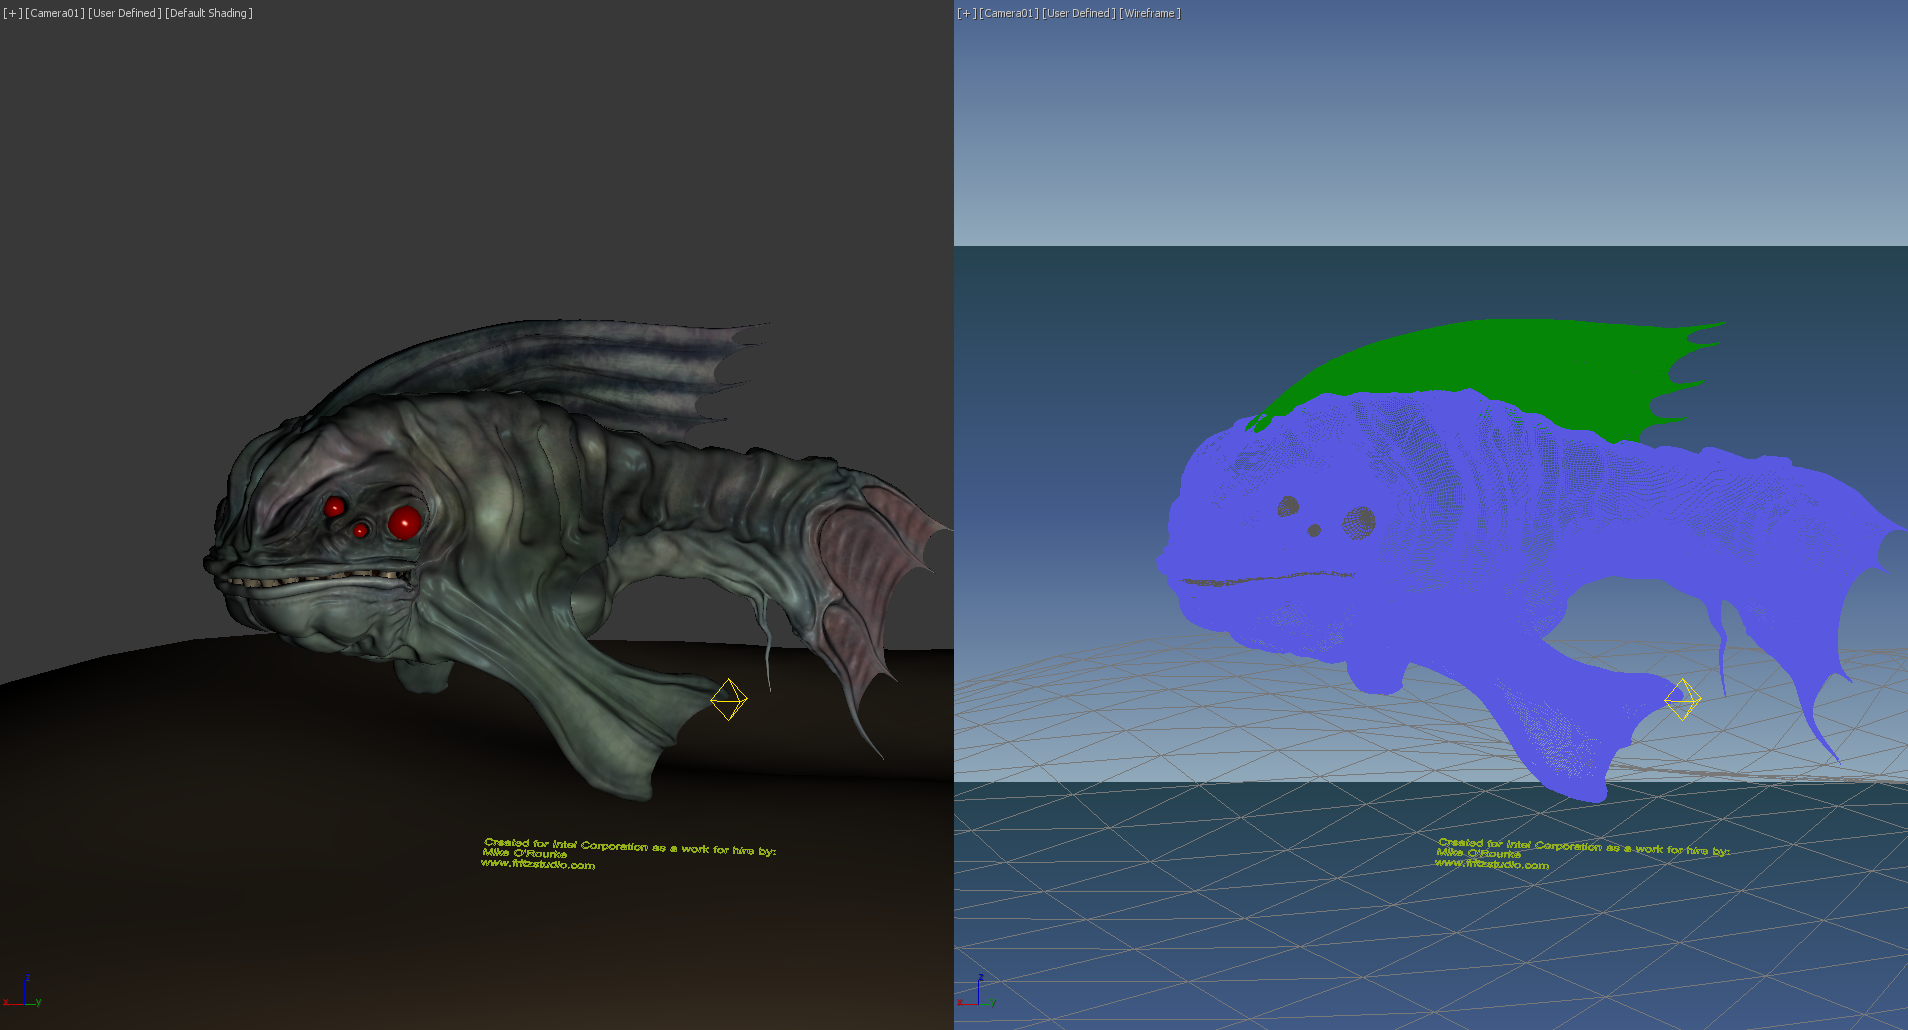
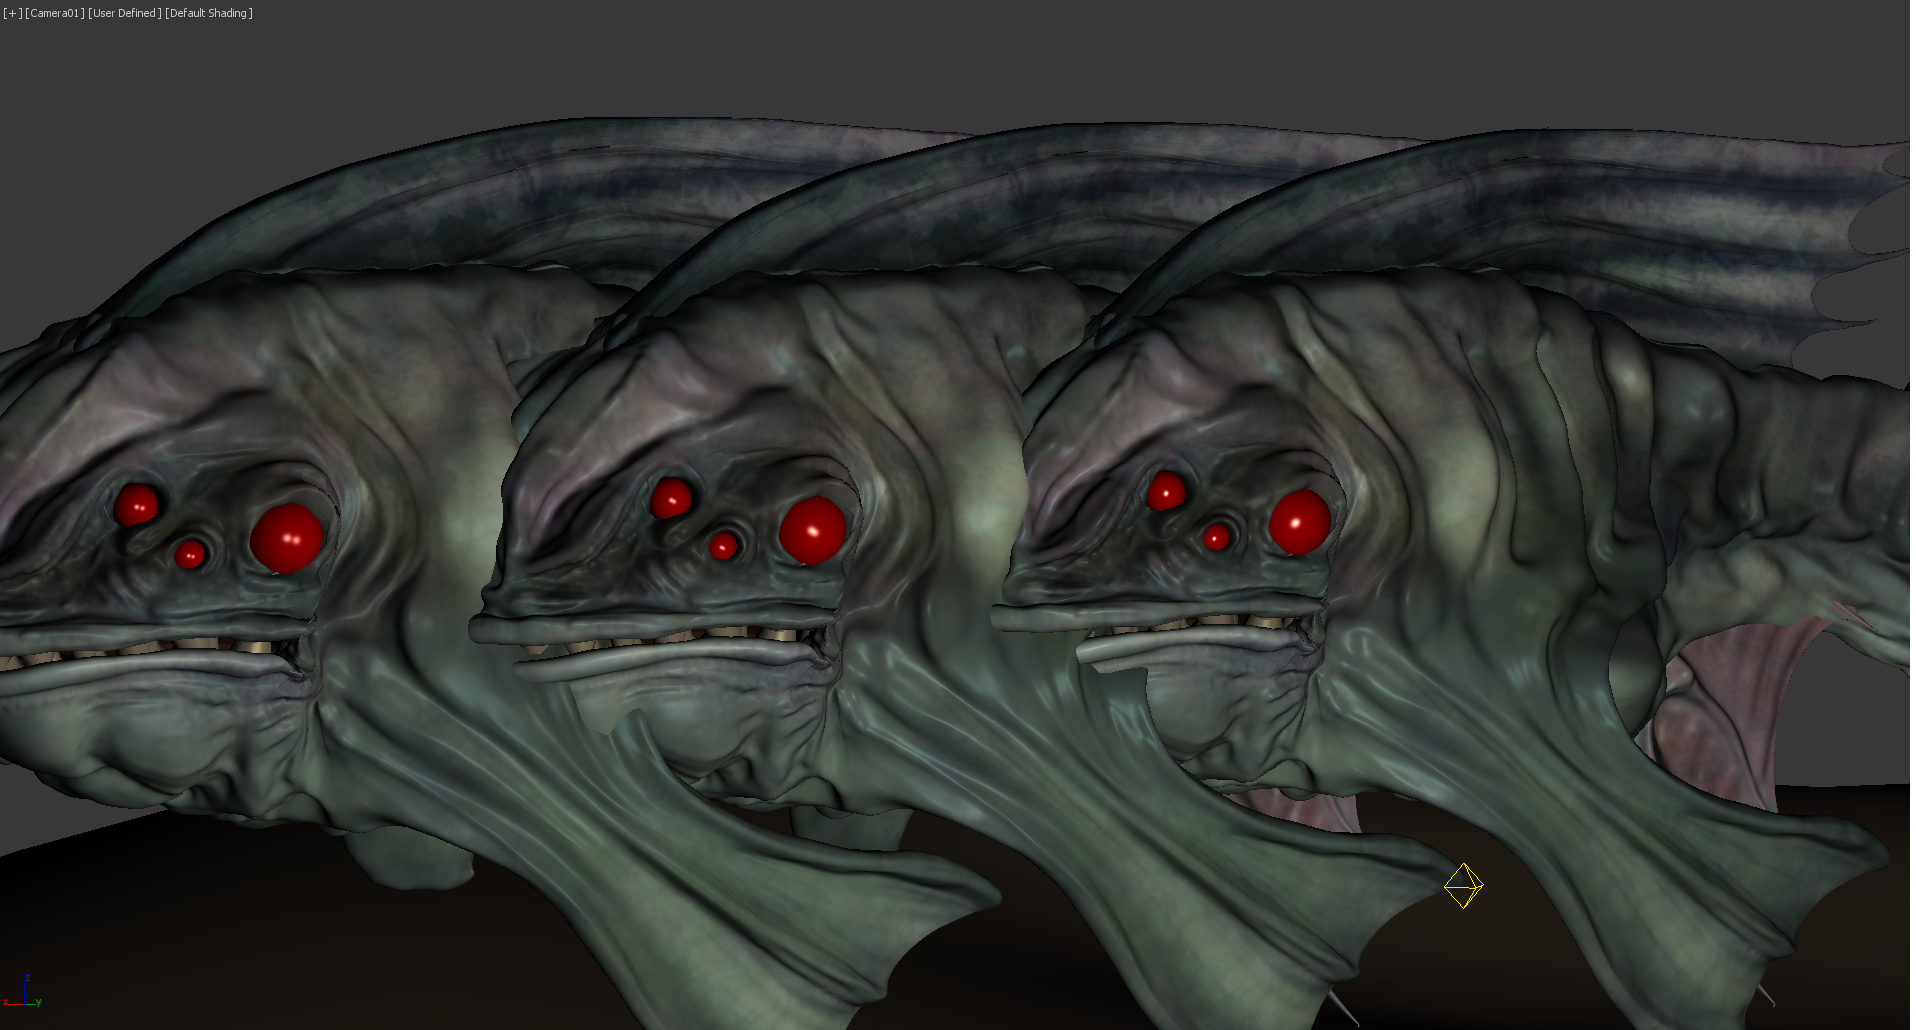
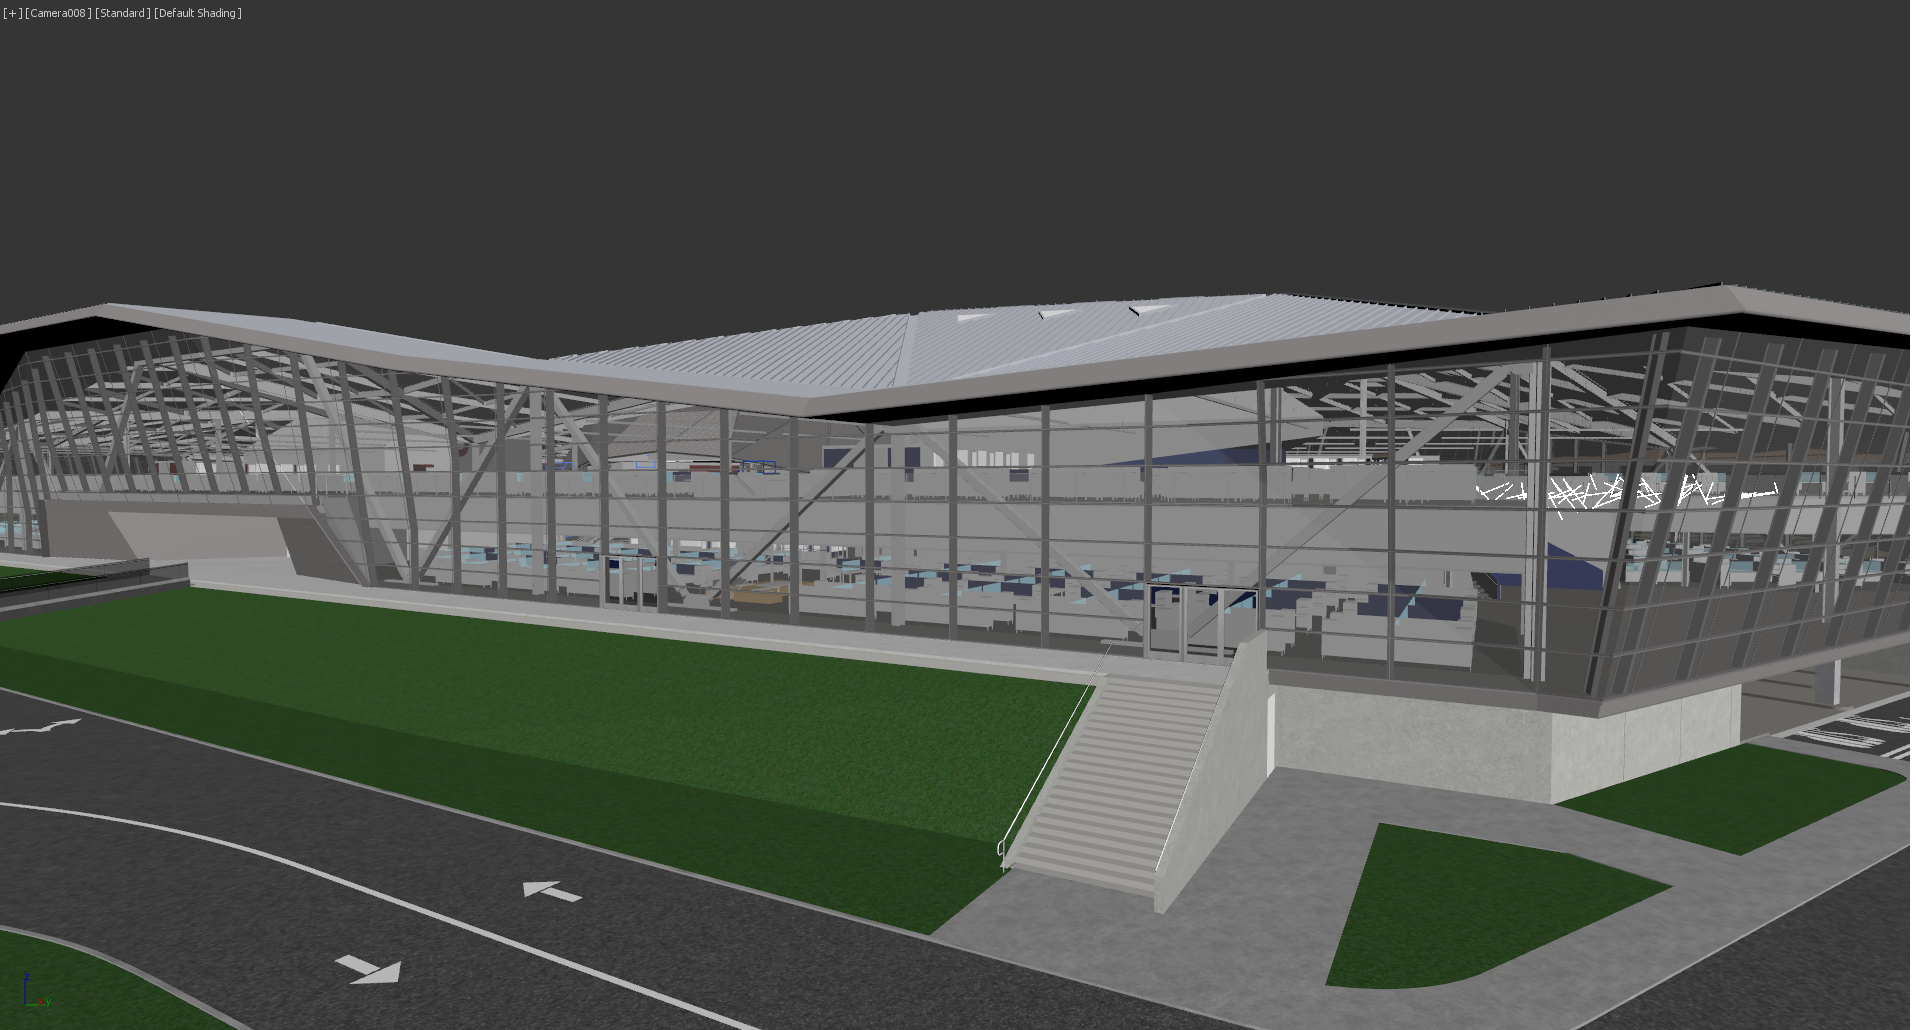
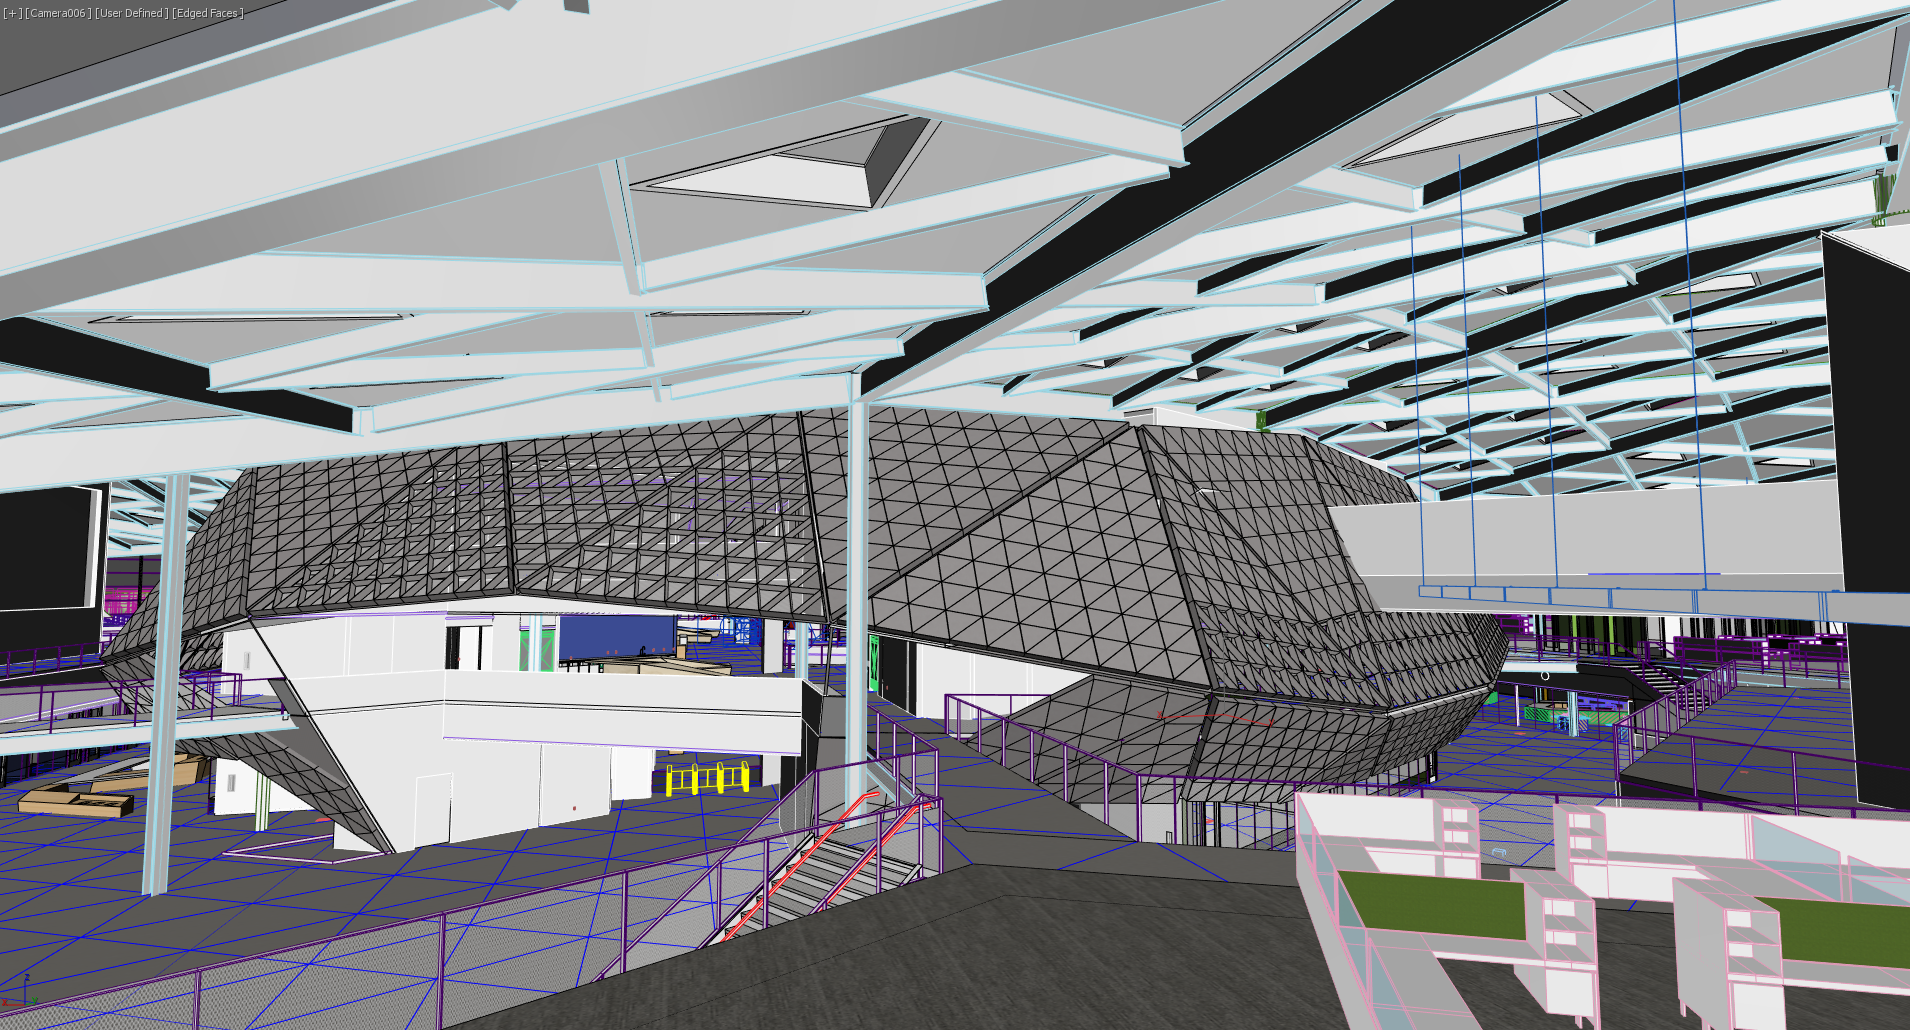
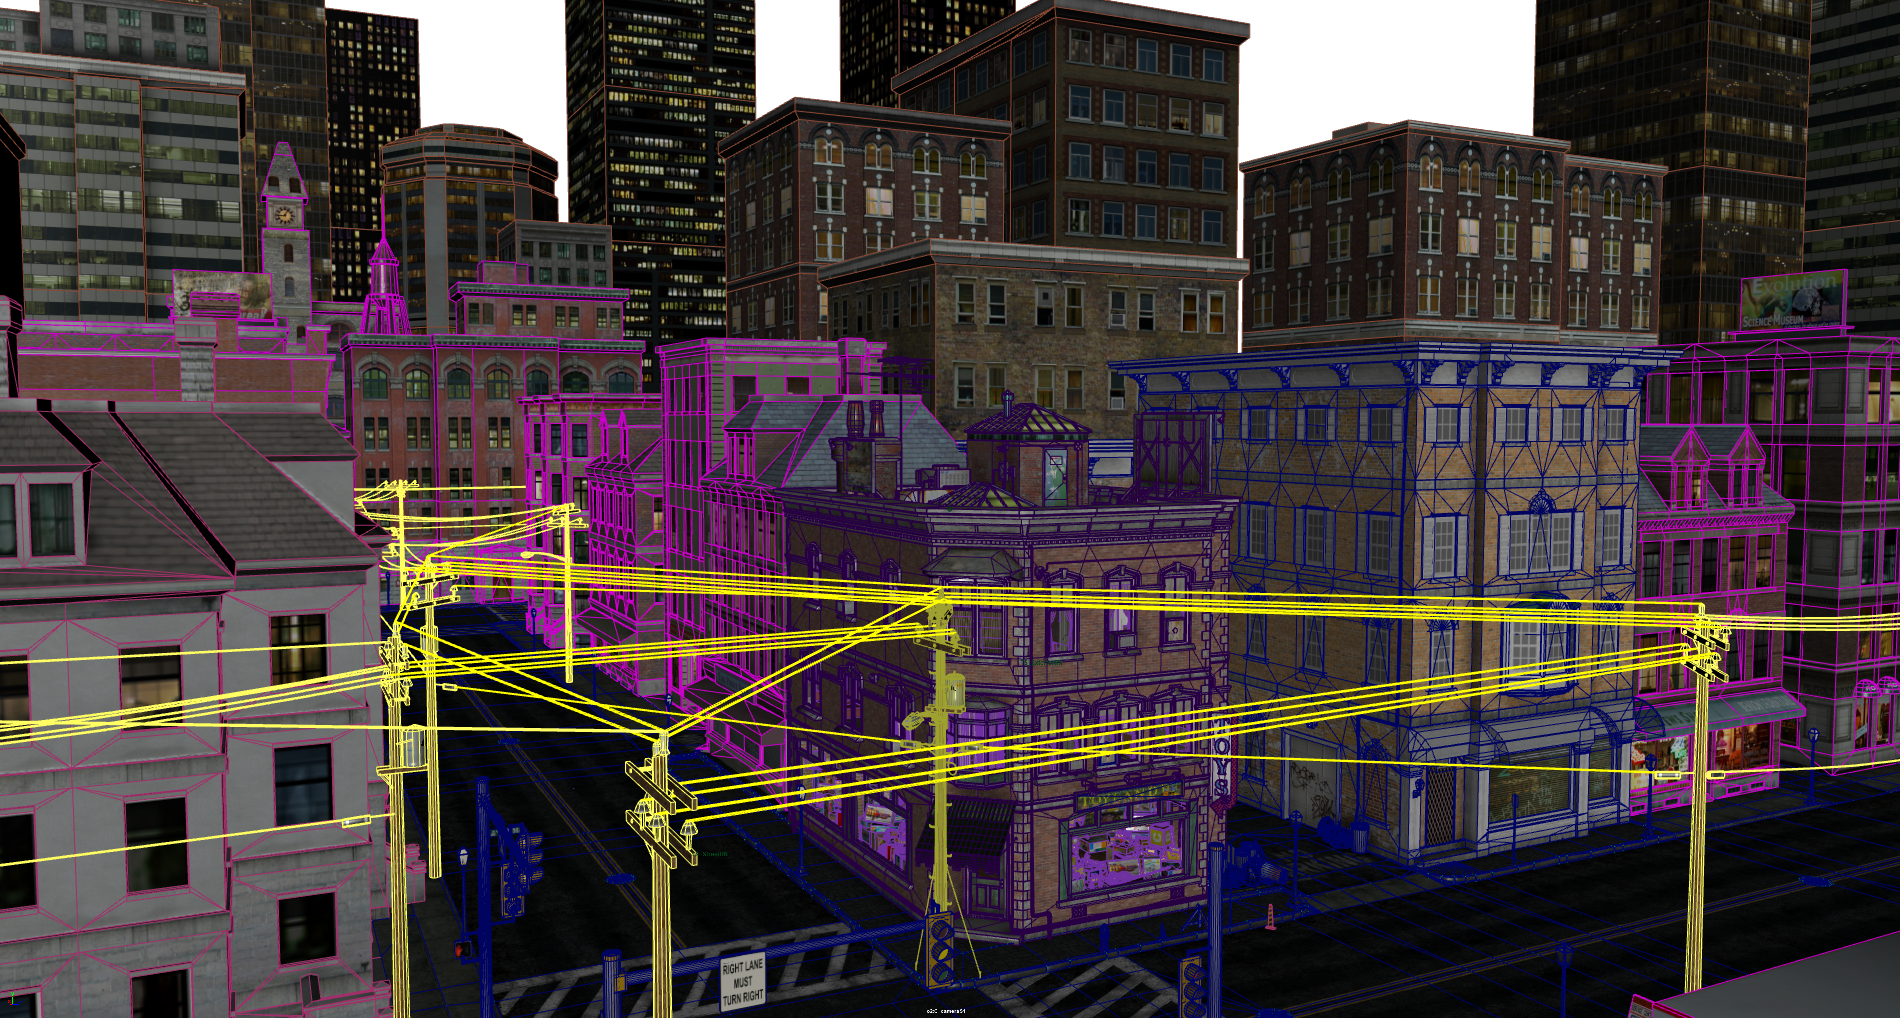
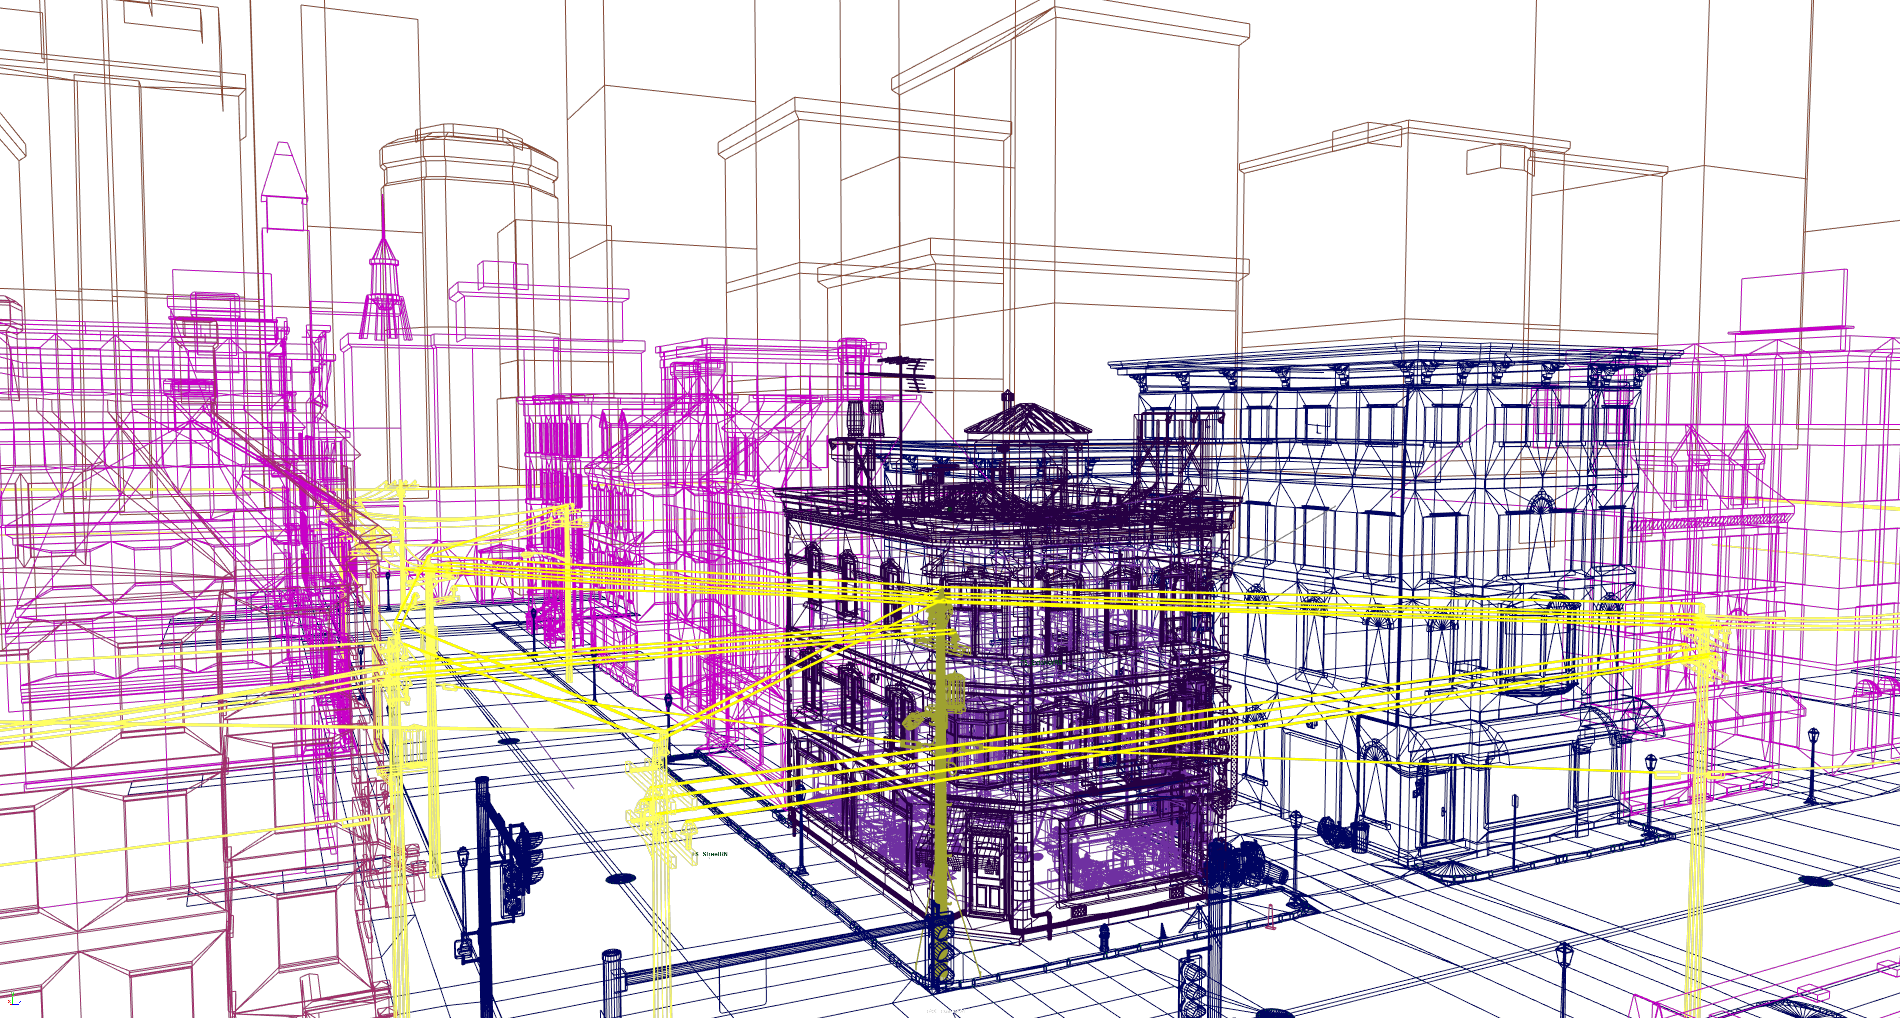
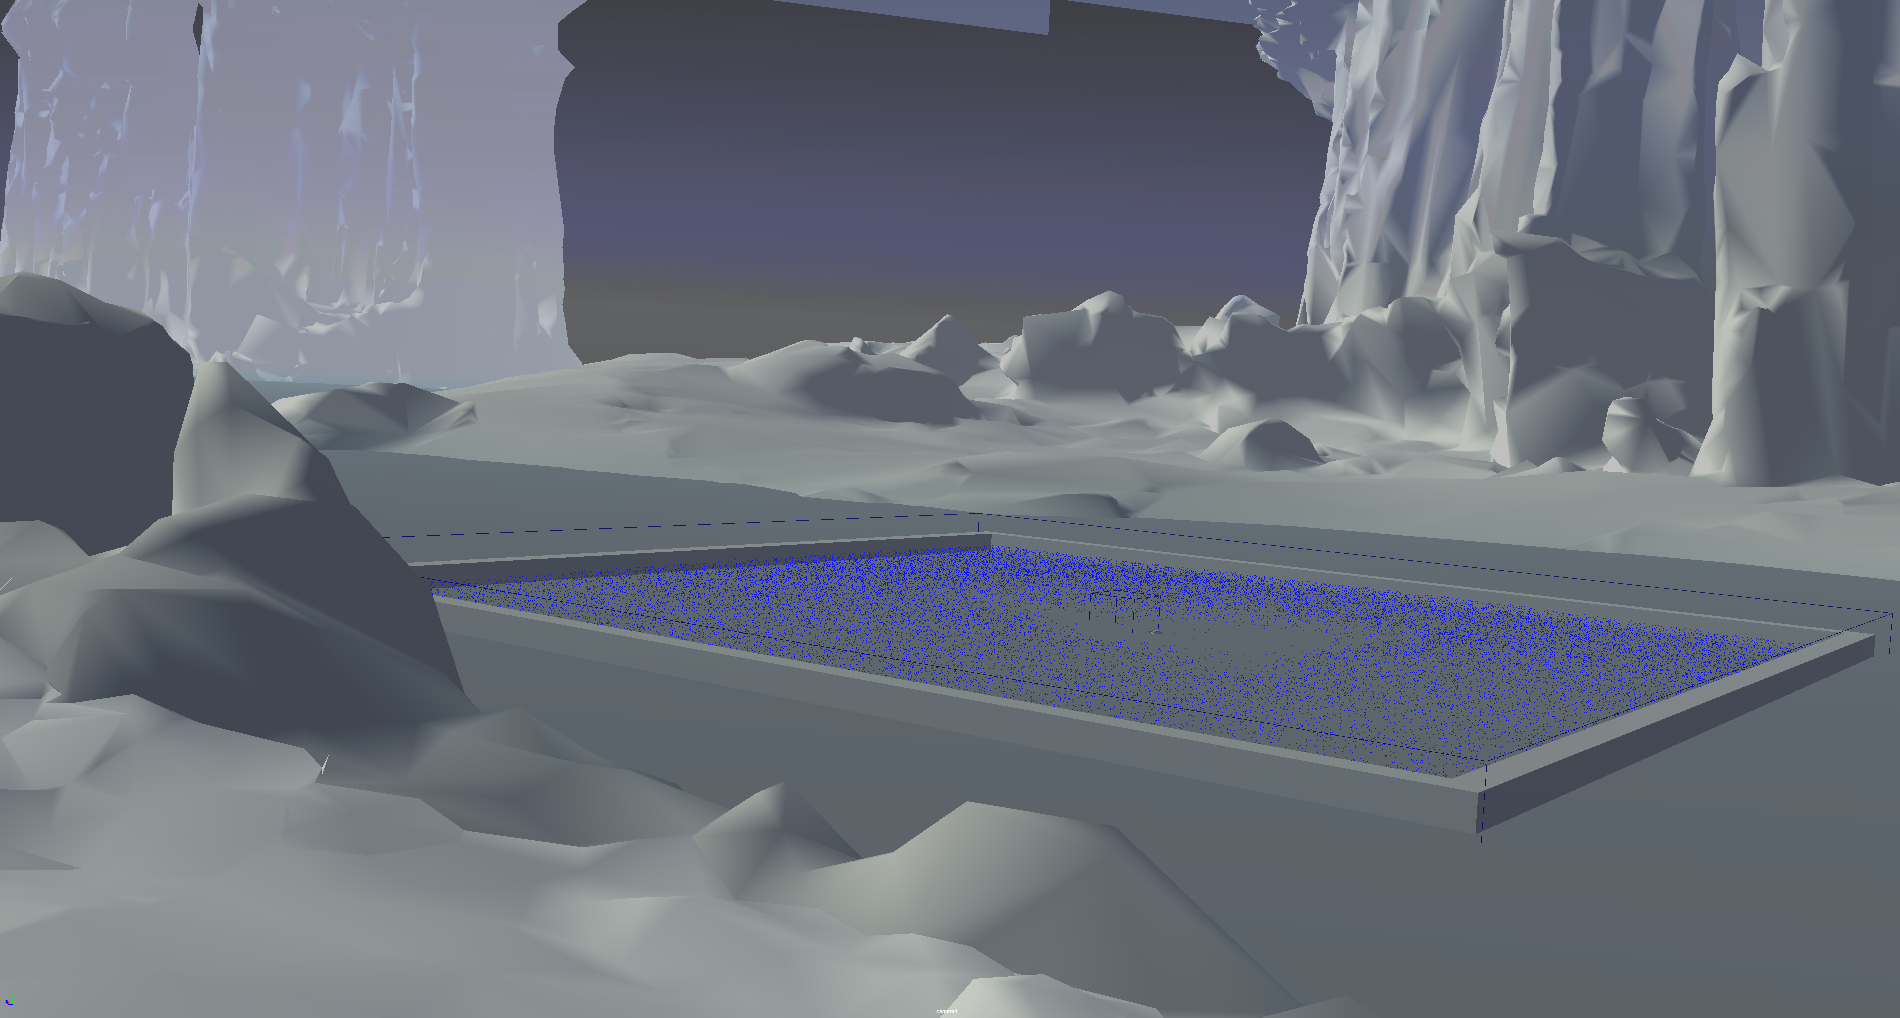
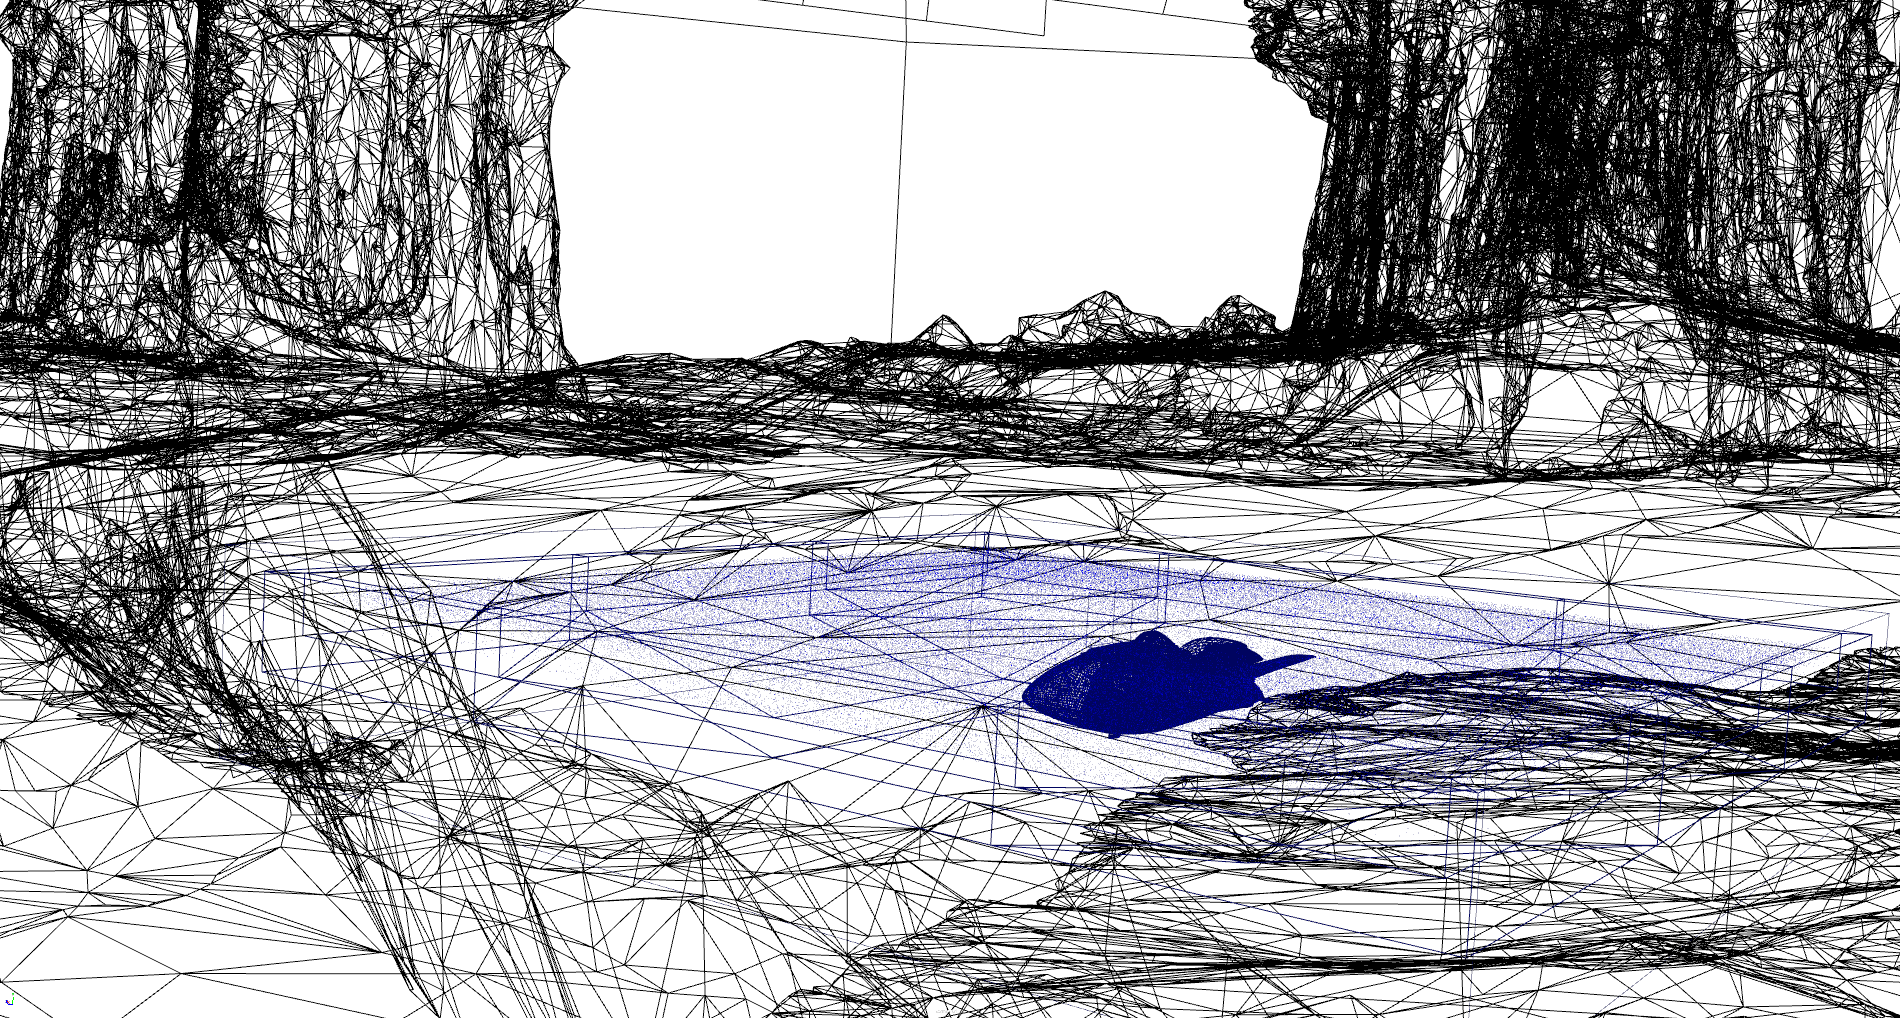
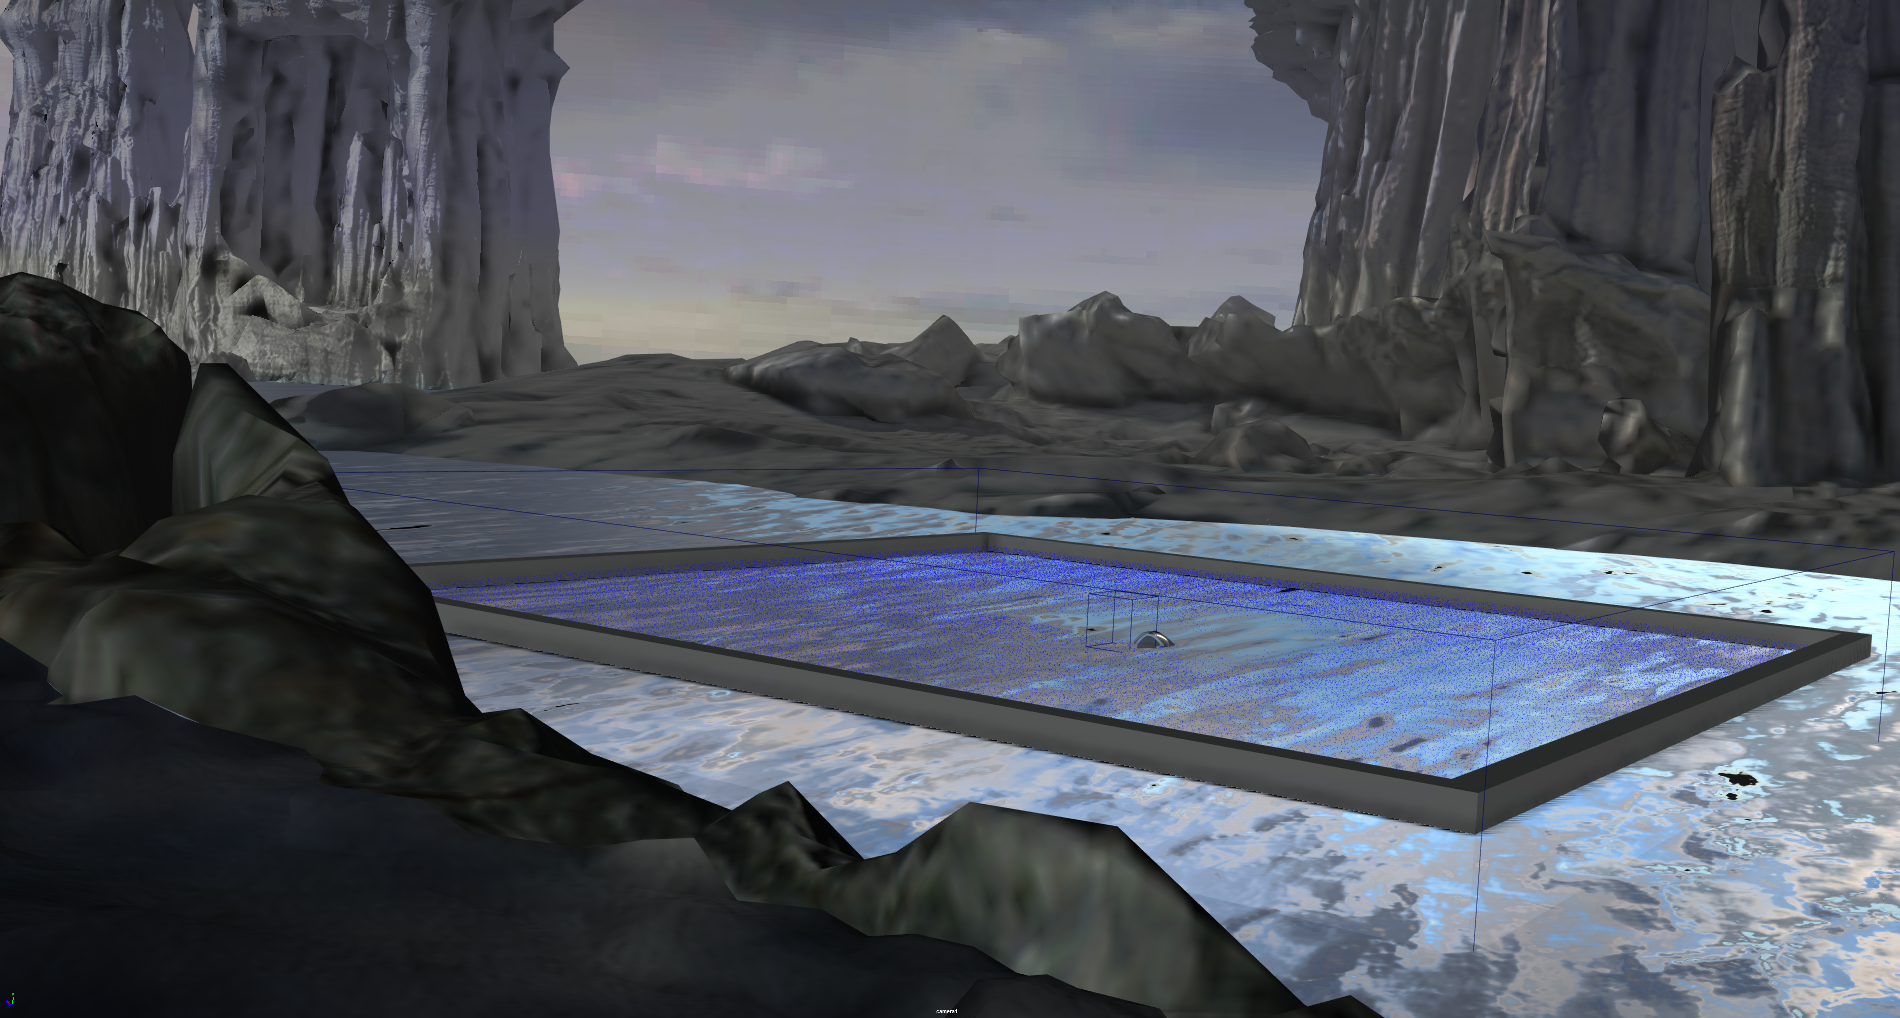
The 3dsmax-07 viewset was created from traces of the graphics workload generated by 3ds Max 2016 using the default Nitrous DX11 driver. The models for this viewset came from the SPECapc for 3ds Max 2015 benchmark and other sources. In order to best approximate real-world use cases, several tests incorporate multiple viewsets on screen, each using a different rendering method. The styles of rendering in the viewset reflect those most commonly used in major markets, including realistic, shaded and wireframe. Some lesser-used but interesting rendering modes such as facets, graphite and clay are also incorporated. The animations in the viewset are a combination of model spin and camera fly-through, depending on the model.
3dsmax-07 composite score: 205.53
The composite score is a weighted geometric mean of the subtest scores. See the table below for subtest weights and FPS scores for this run.
Subtest results
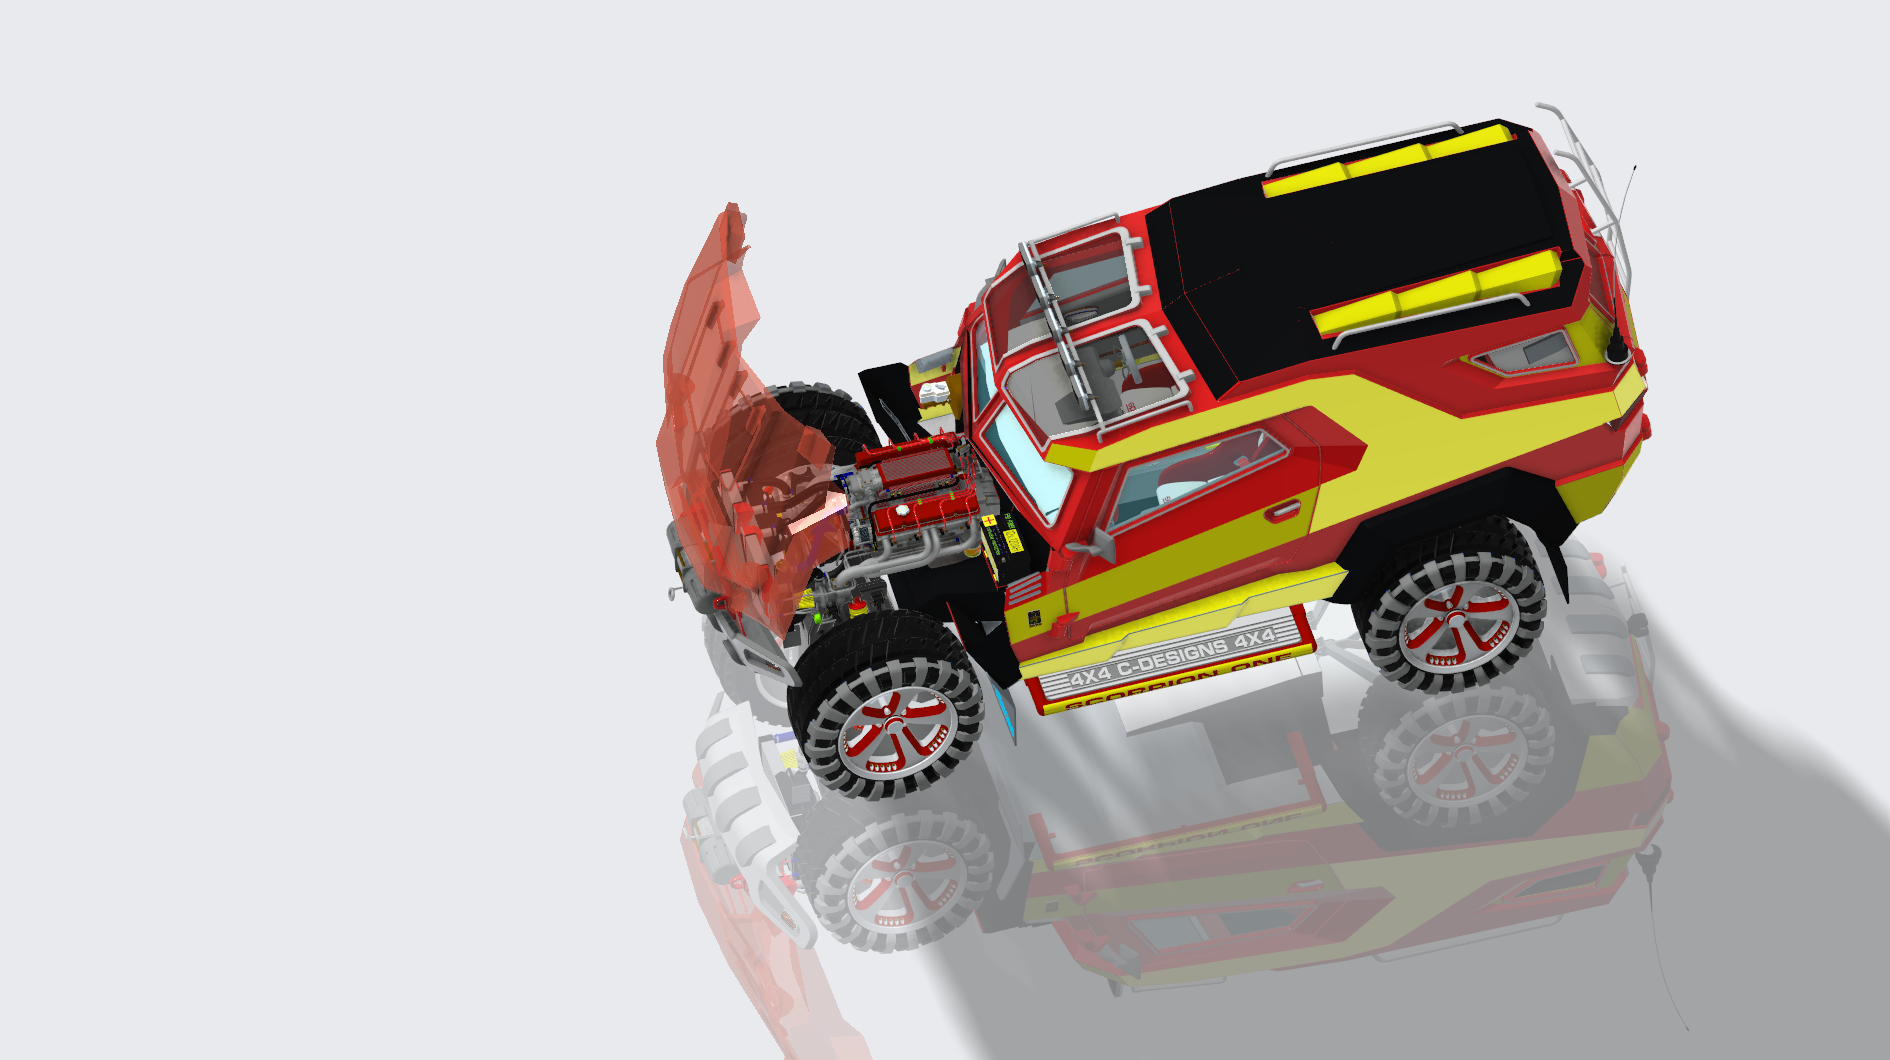
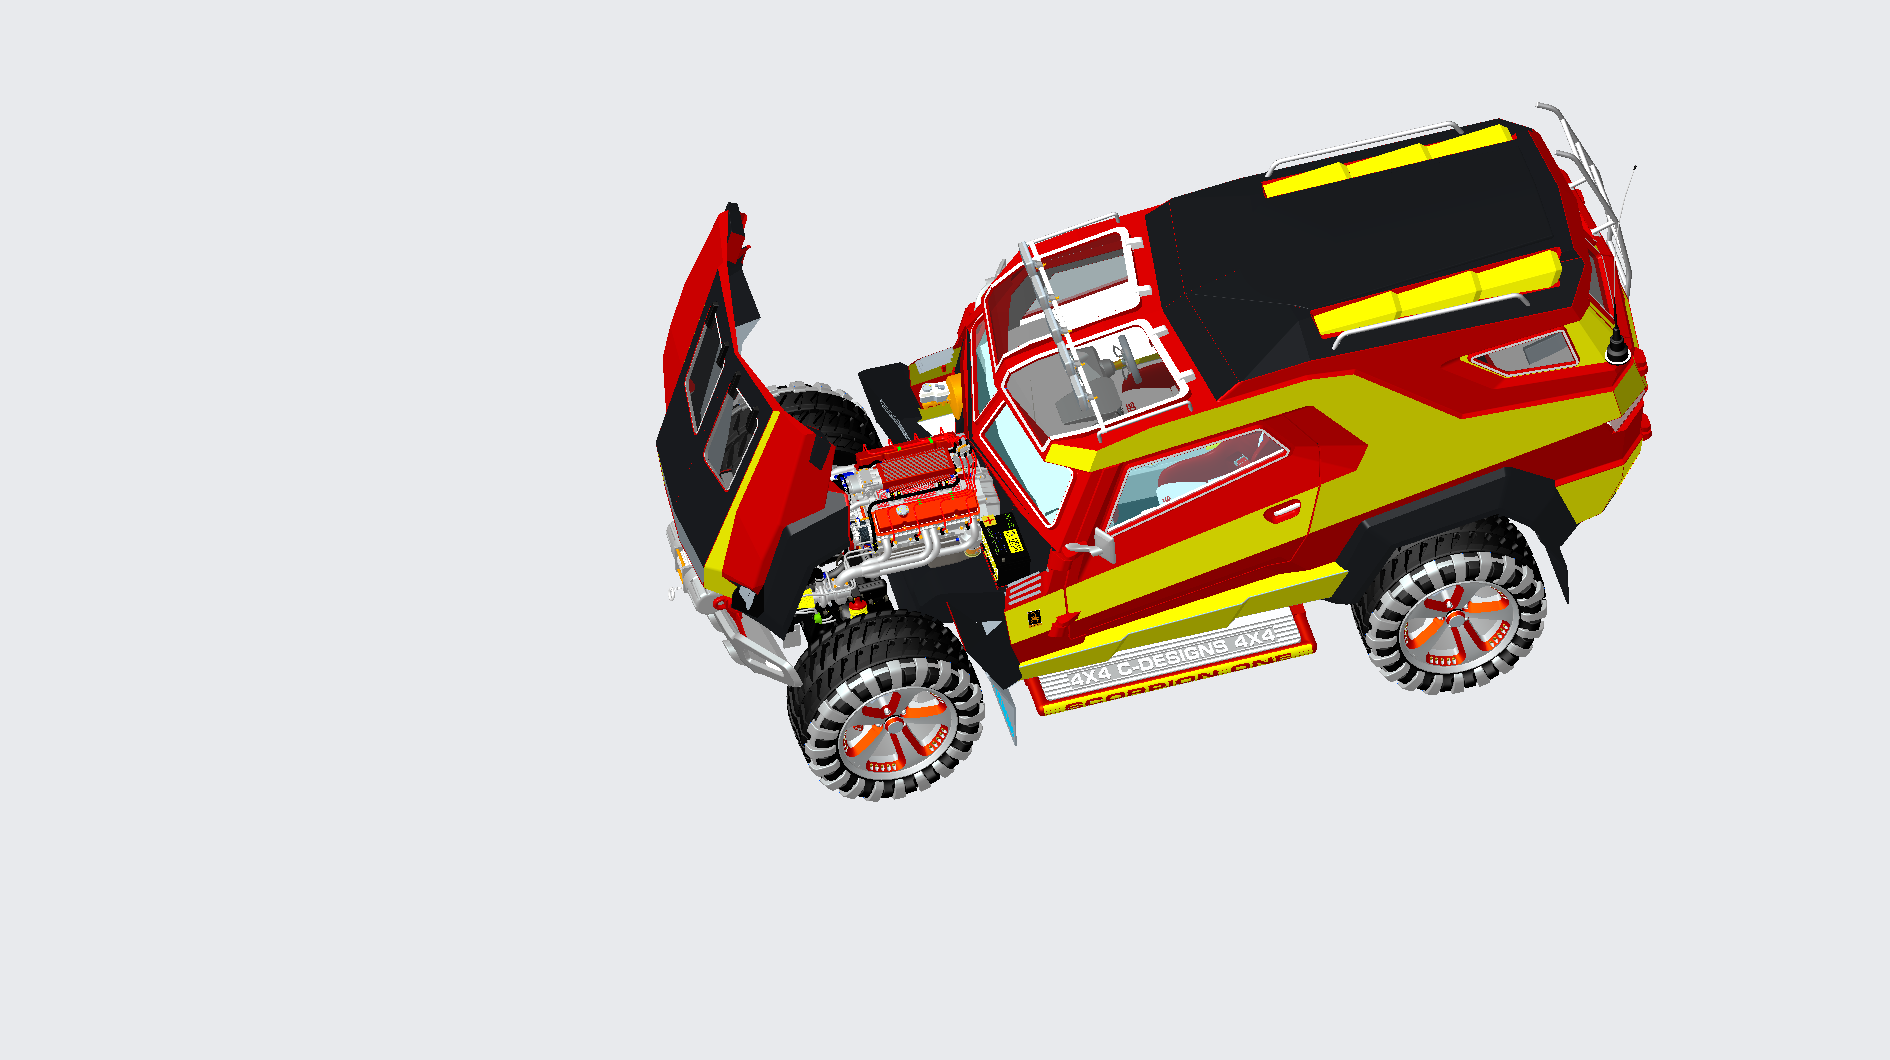
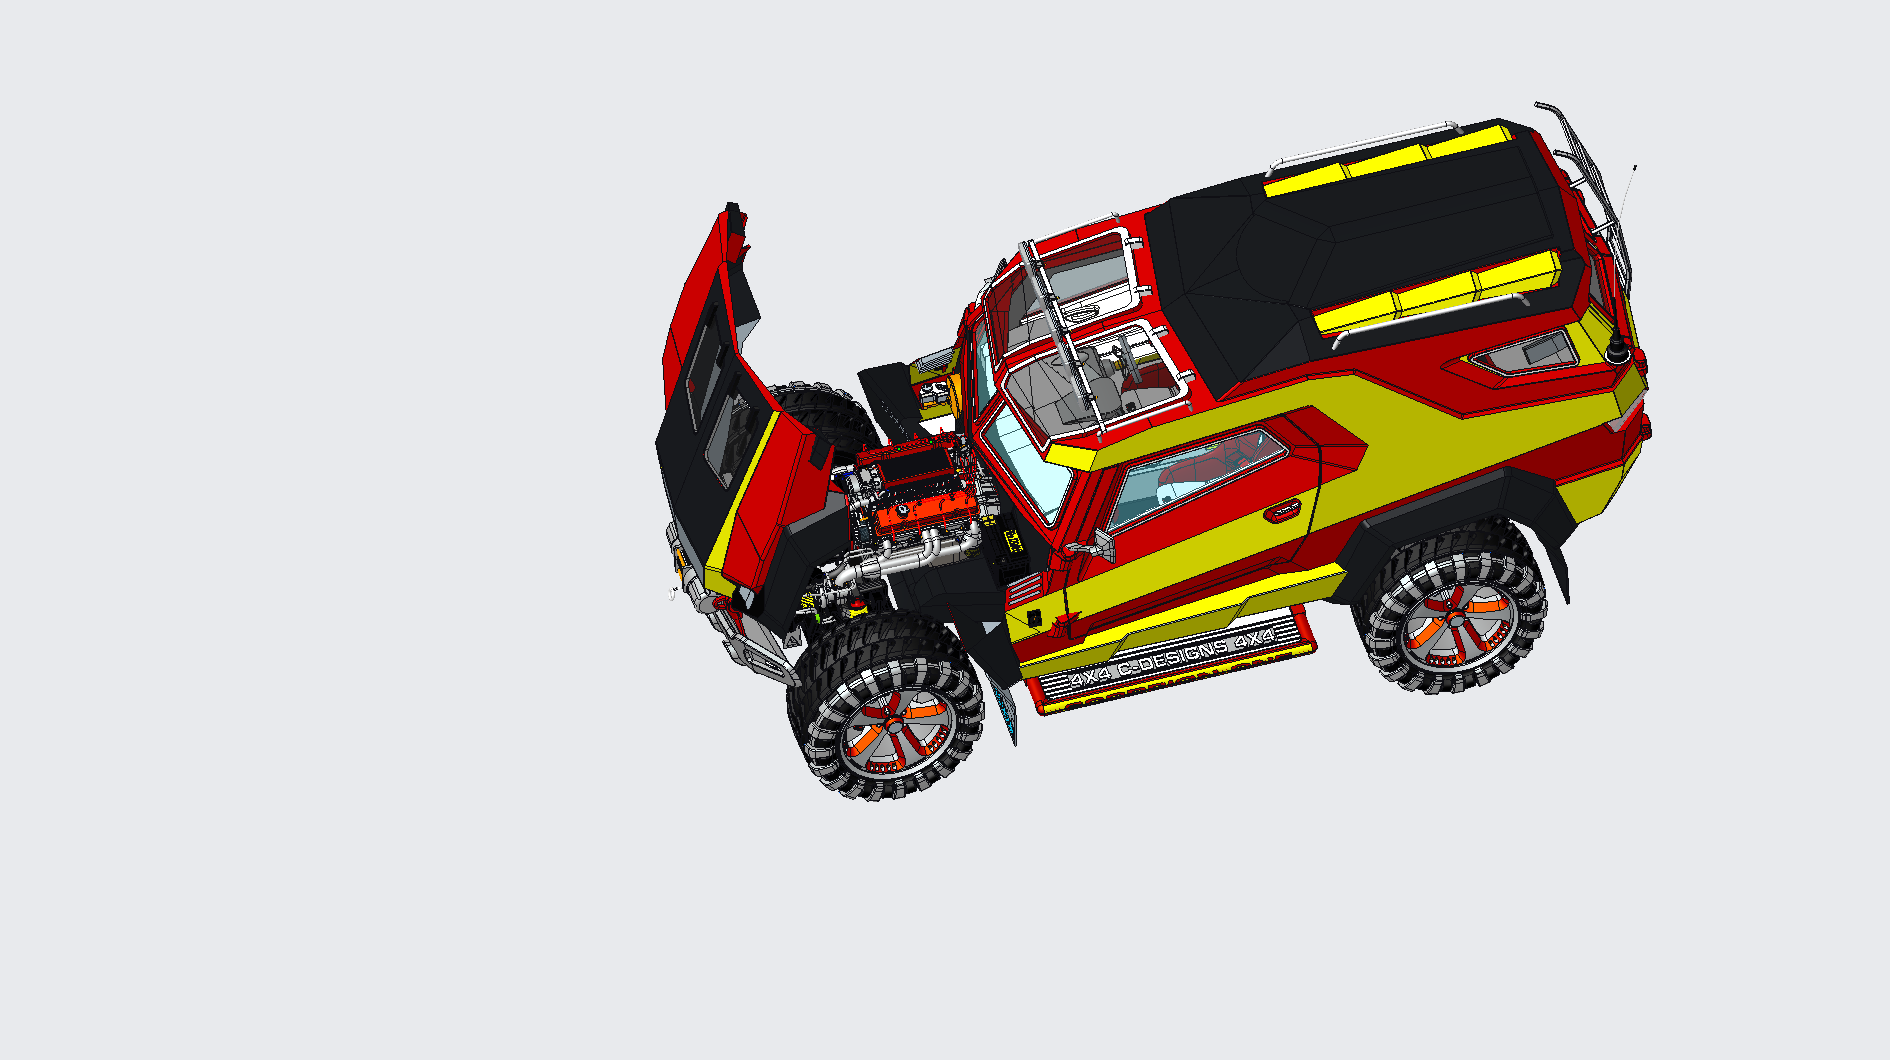
Click on each thumbnail image below to display the subtest's screen grab.
The results table above includes the details about each test within a viewset. Viewsets are often comprised of many tests which produce a frame rate. Frame rate is computed as the average Frames Per Second (FPS), or the total number of frames rendered divided by the time in seconds to render those frames. These FPS values are then used to compute the composite score using the weights for each test.
Screen Grabs Folder
Text Log File
XML Result File
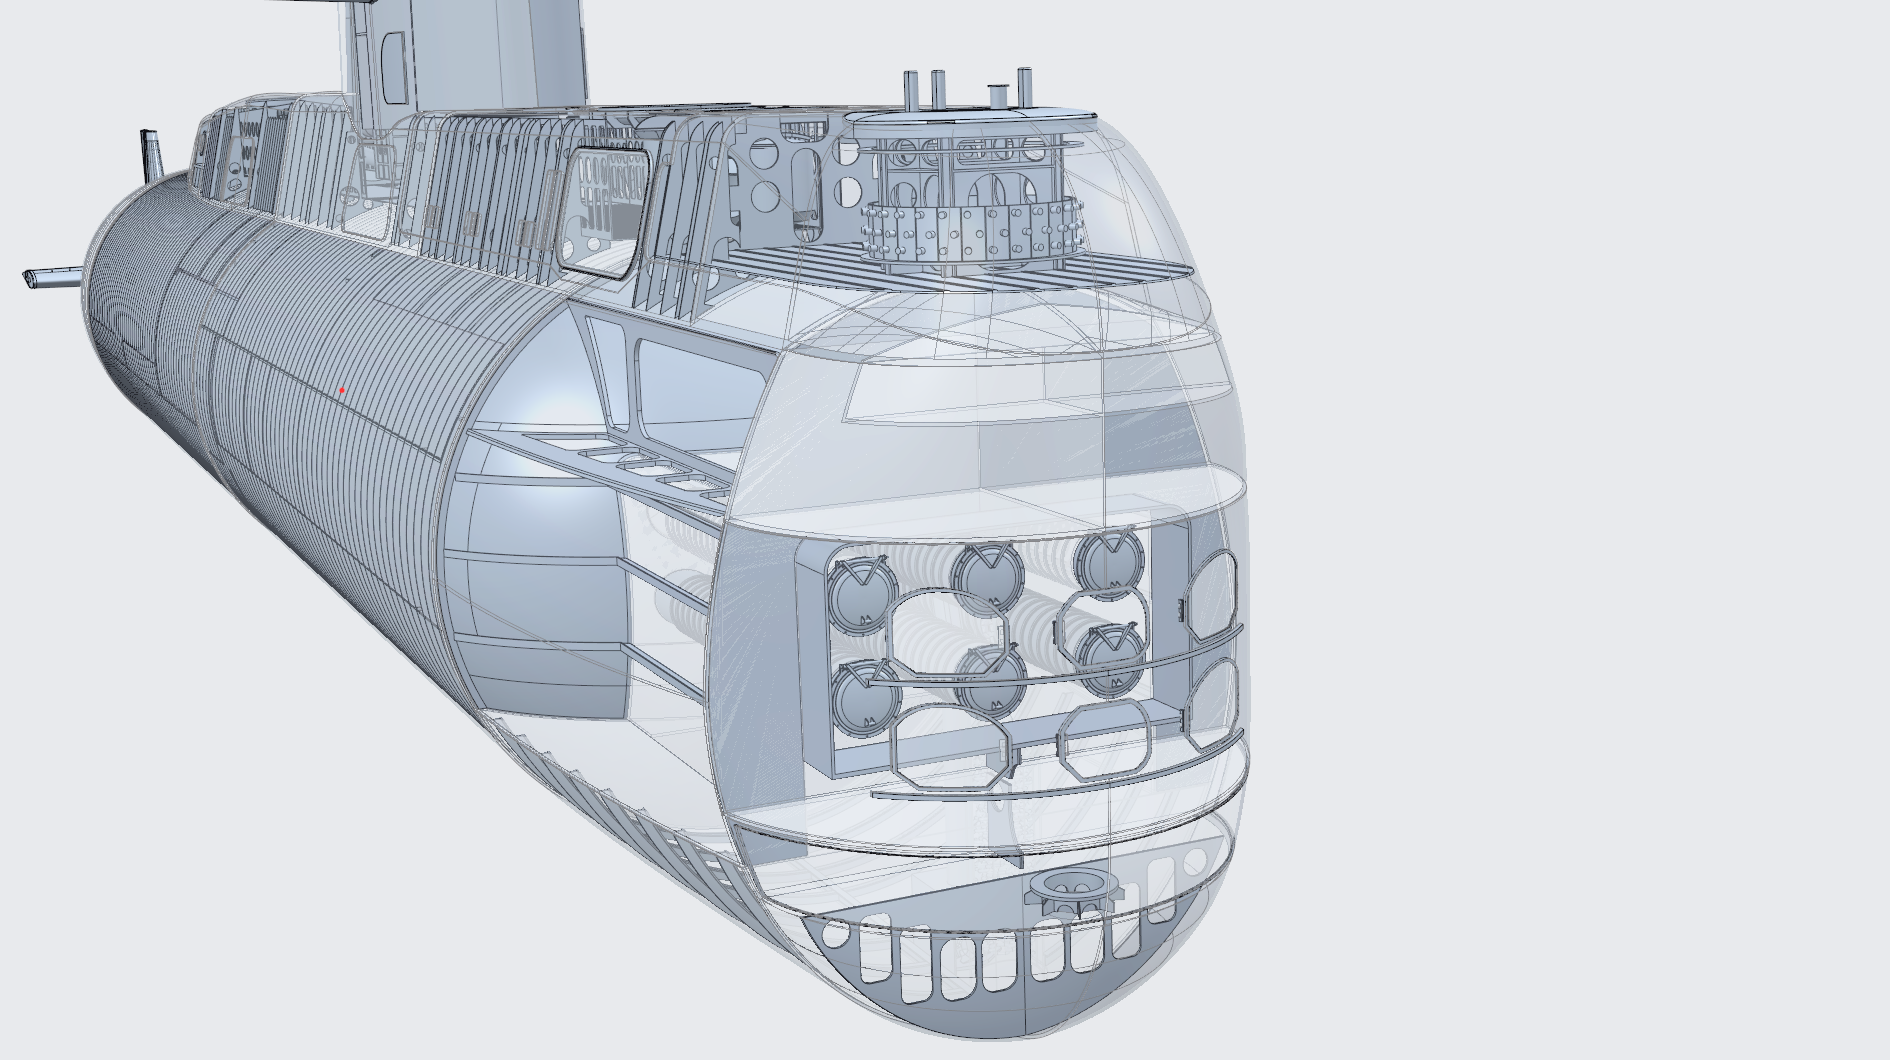
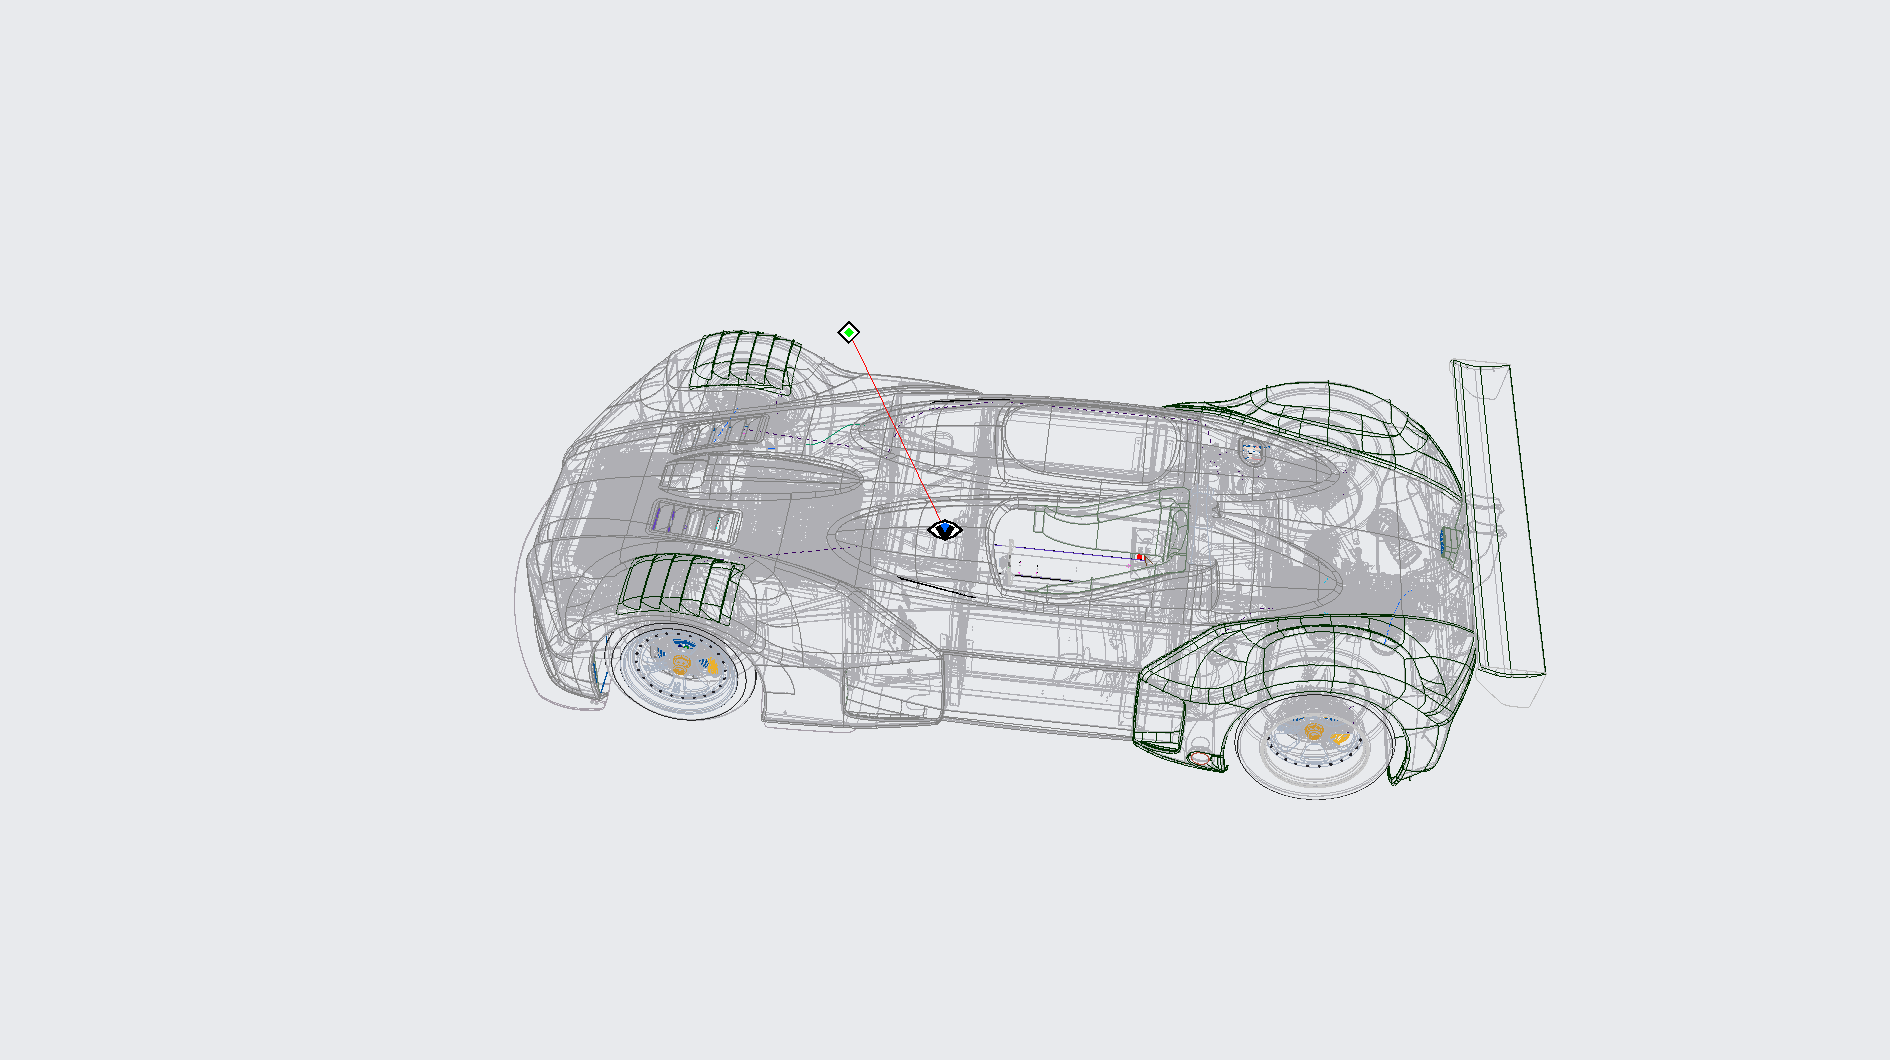
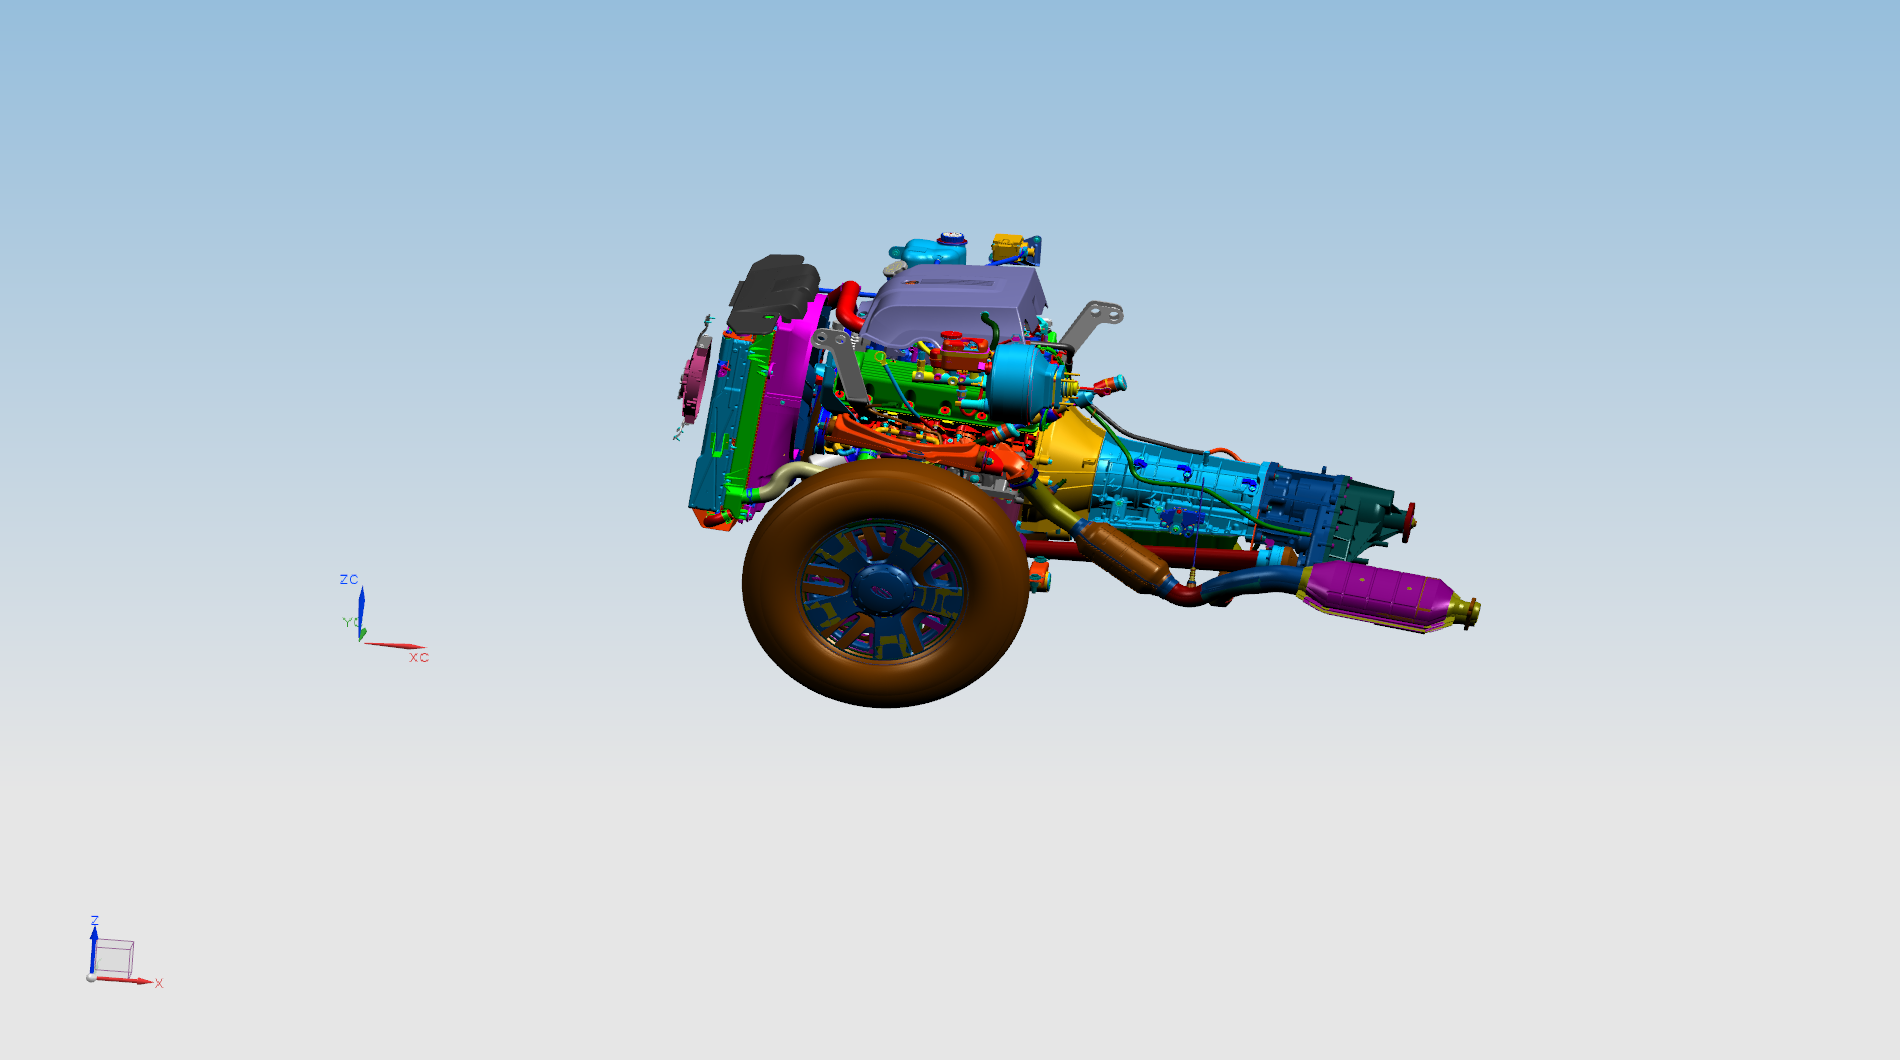
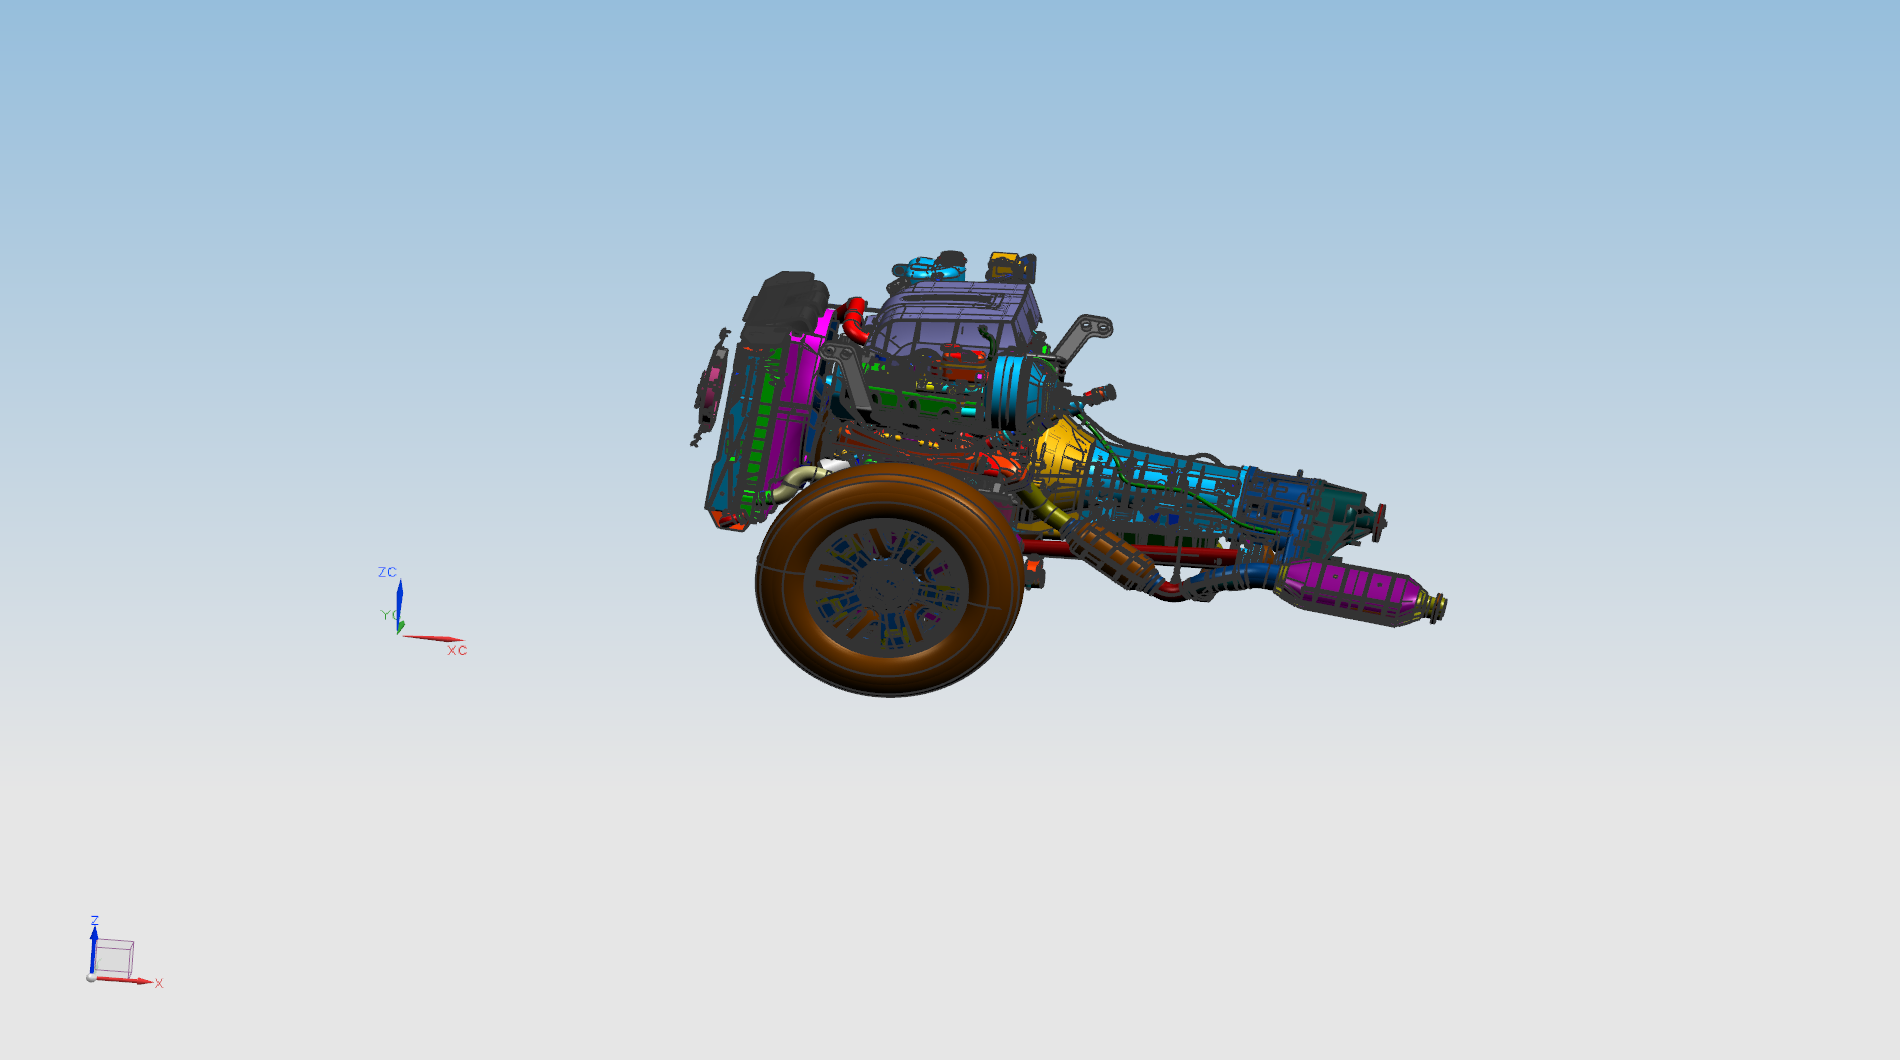
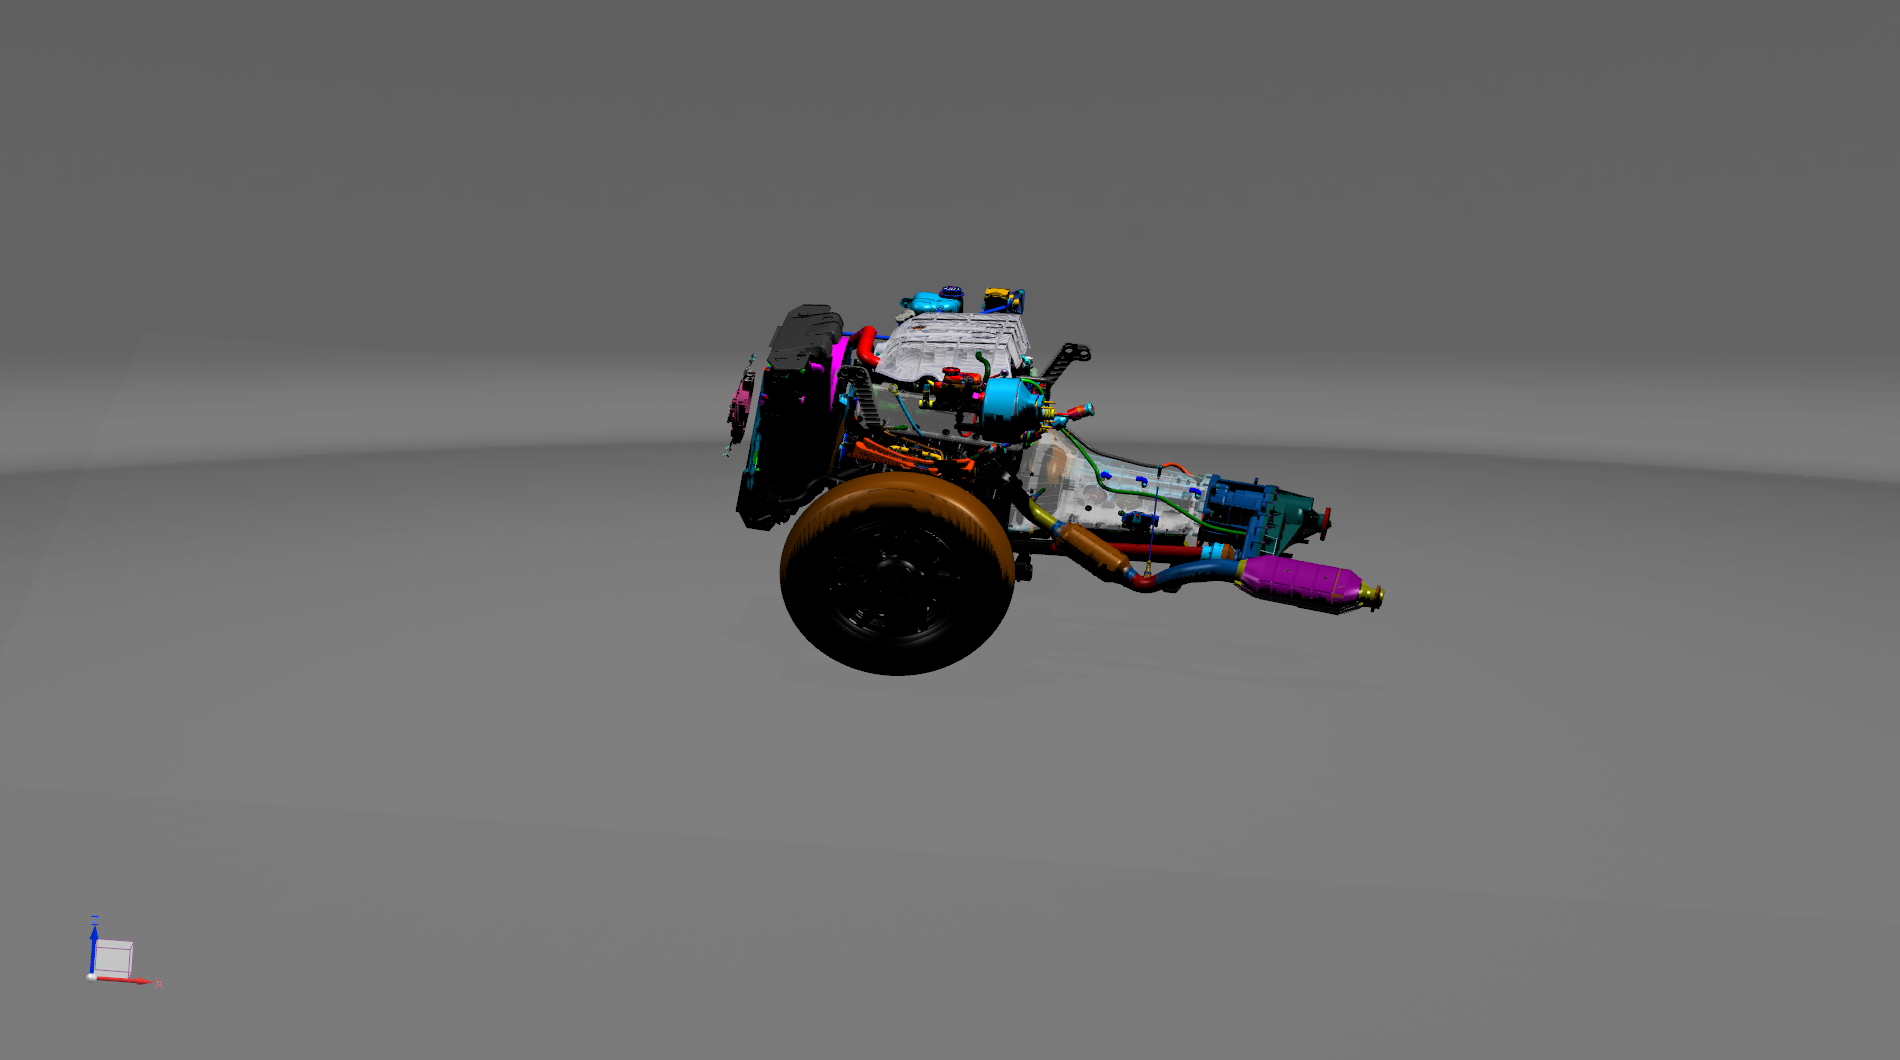
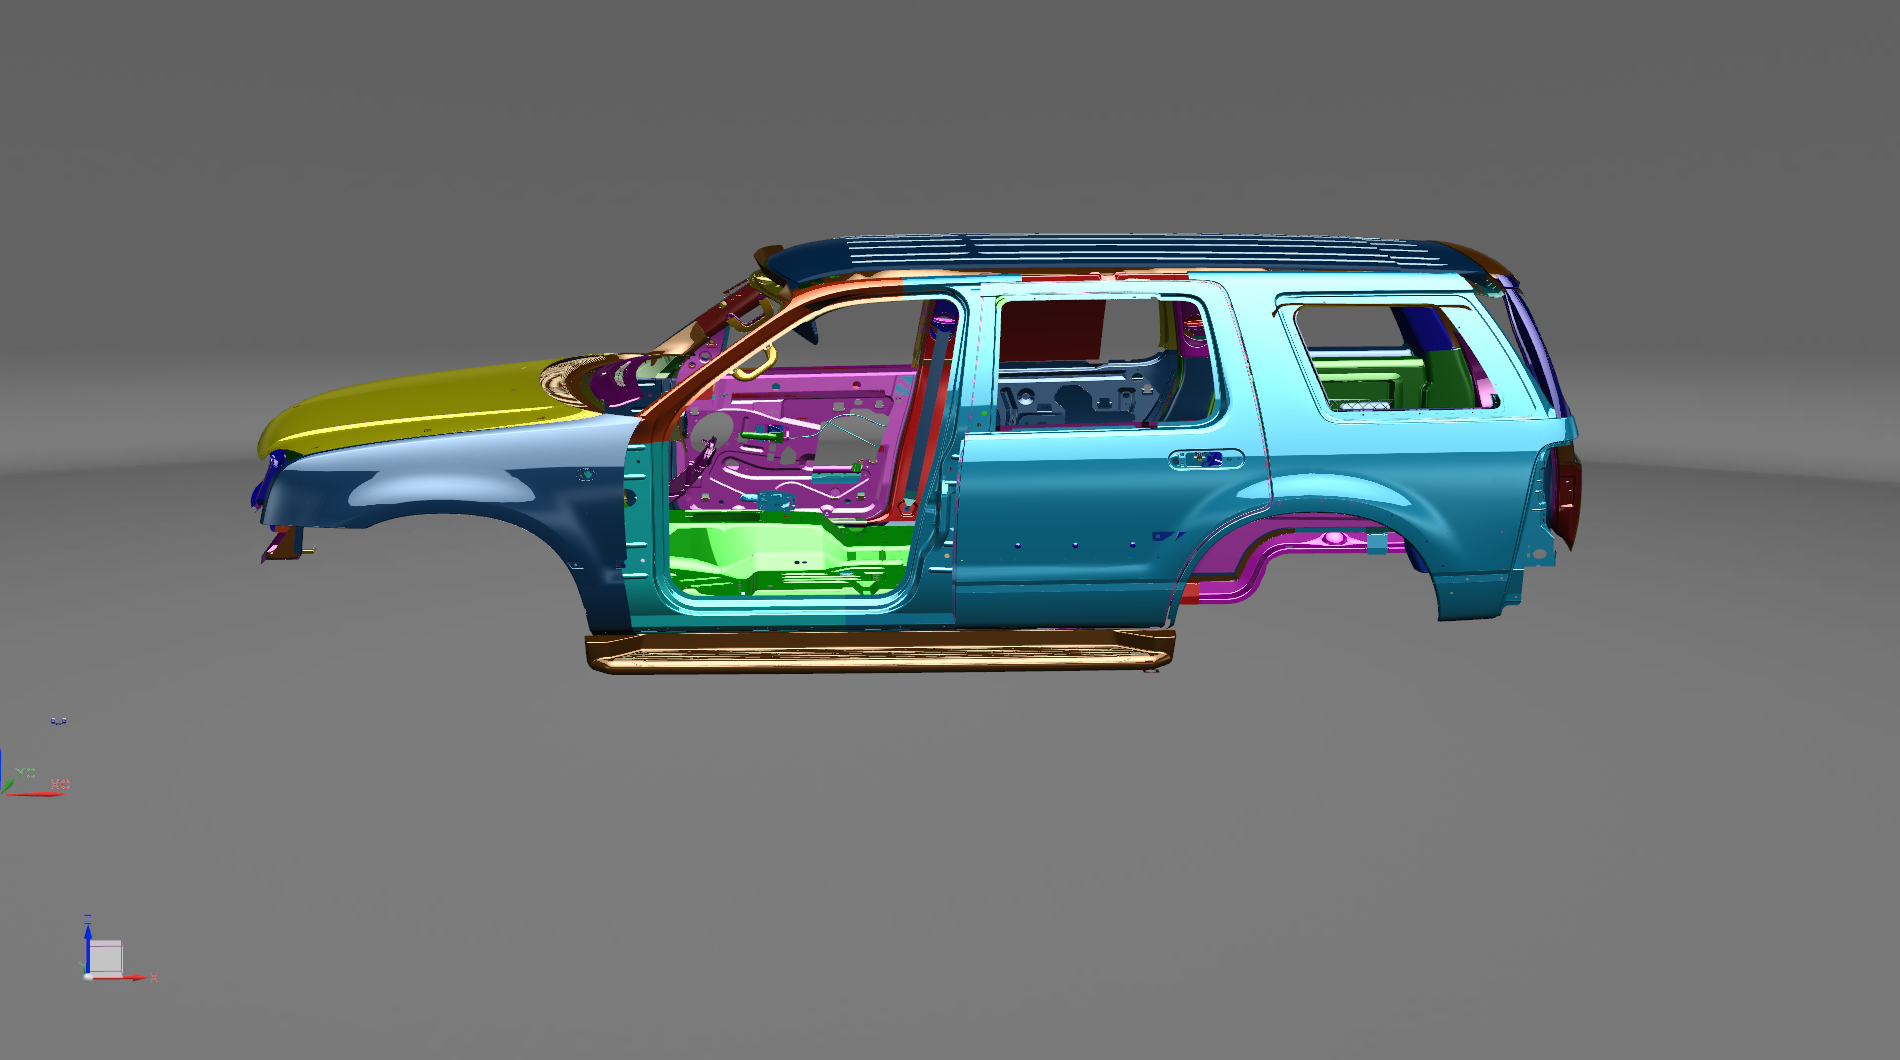
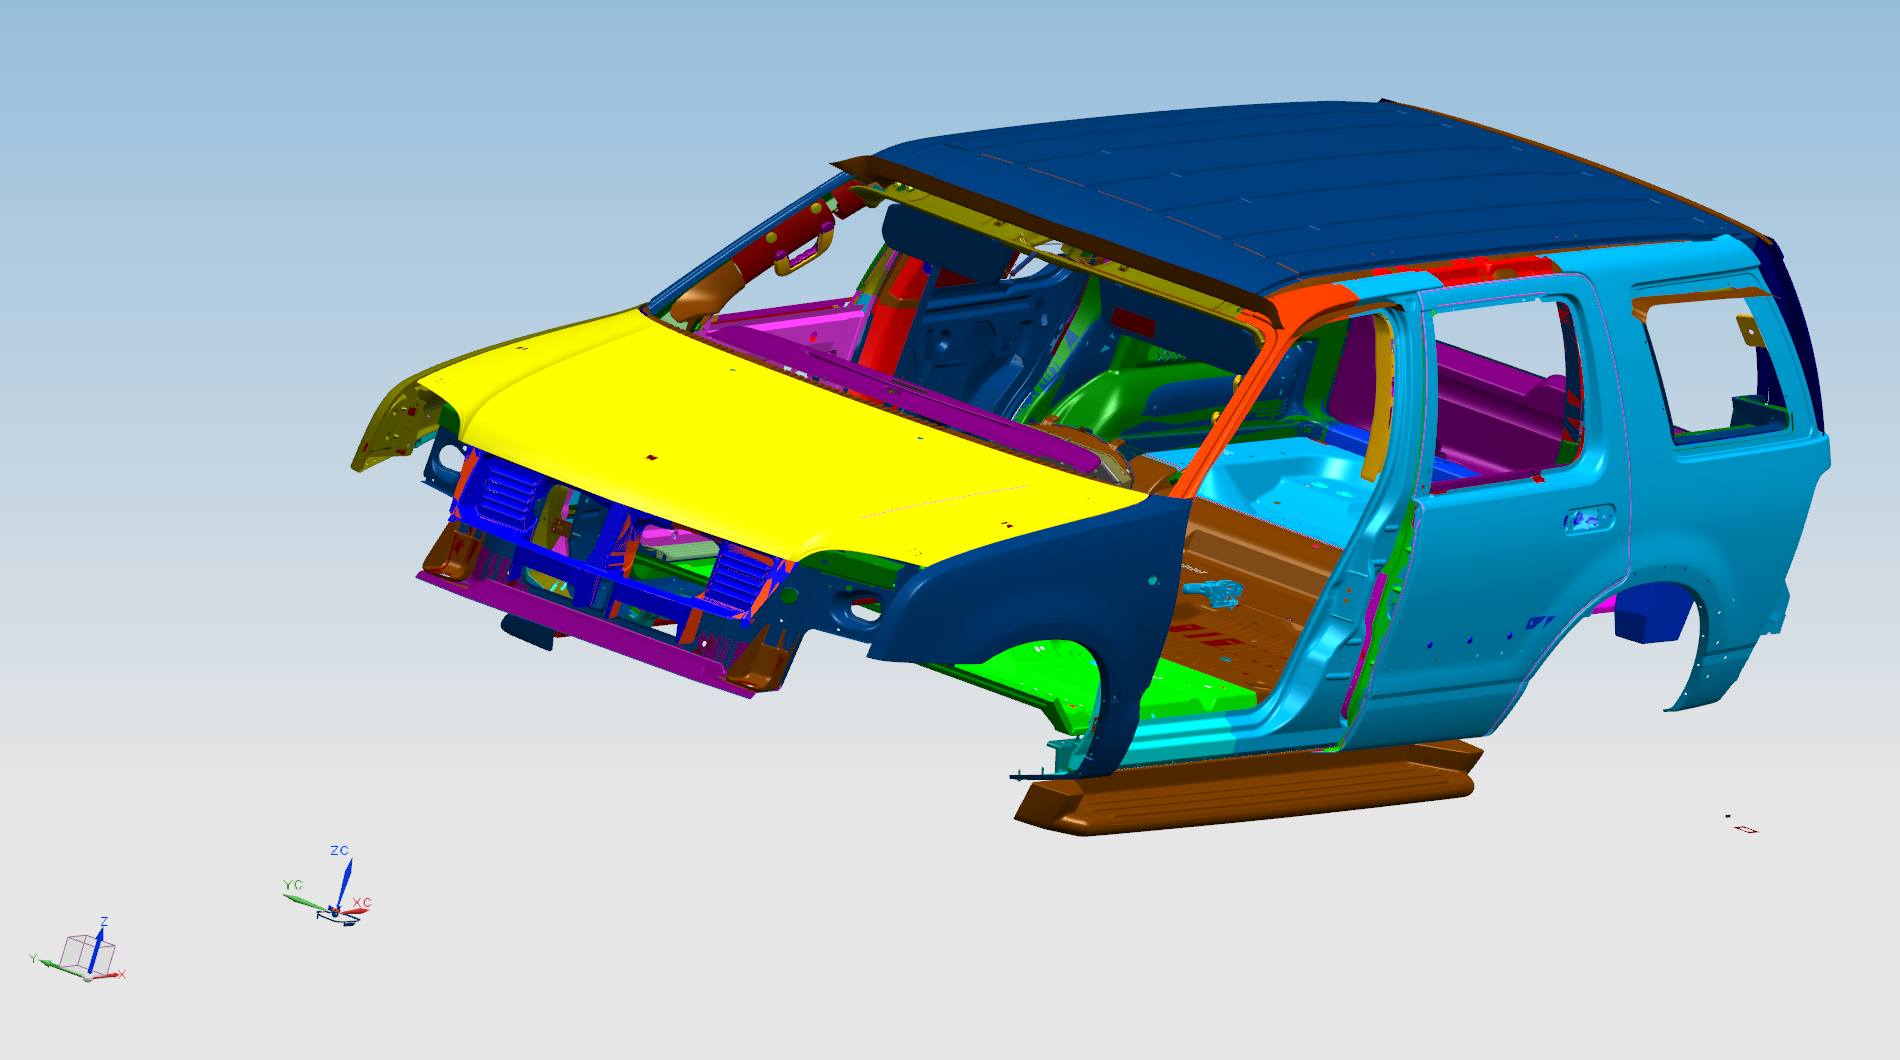
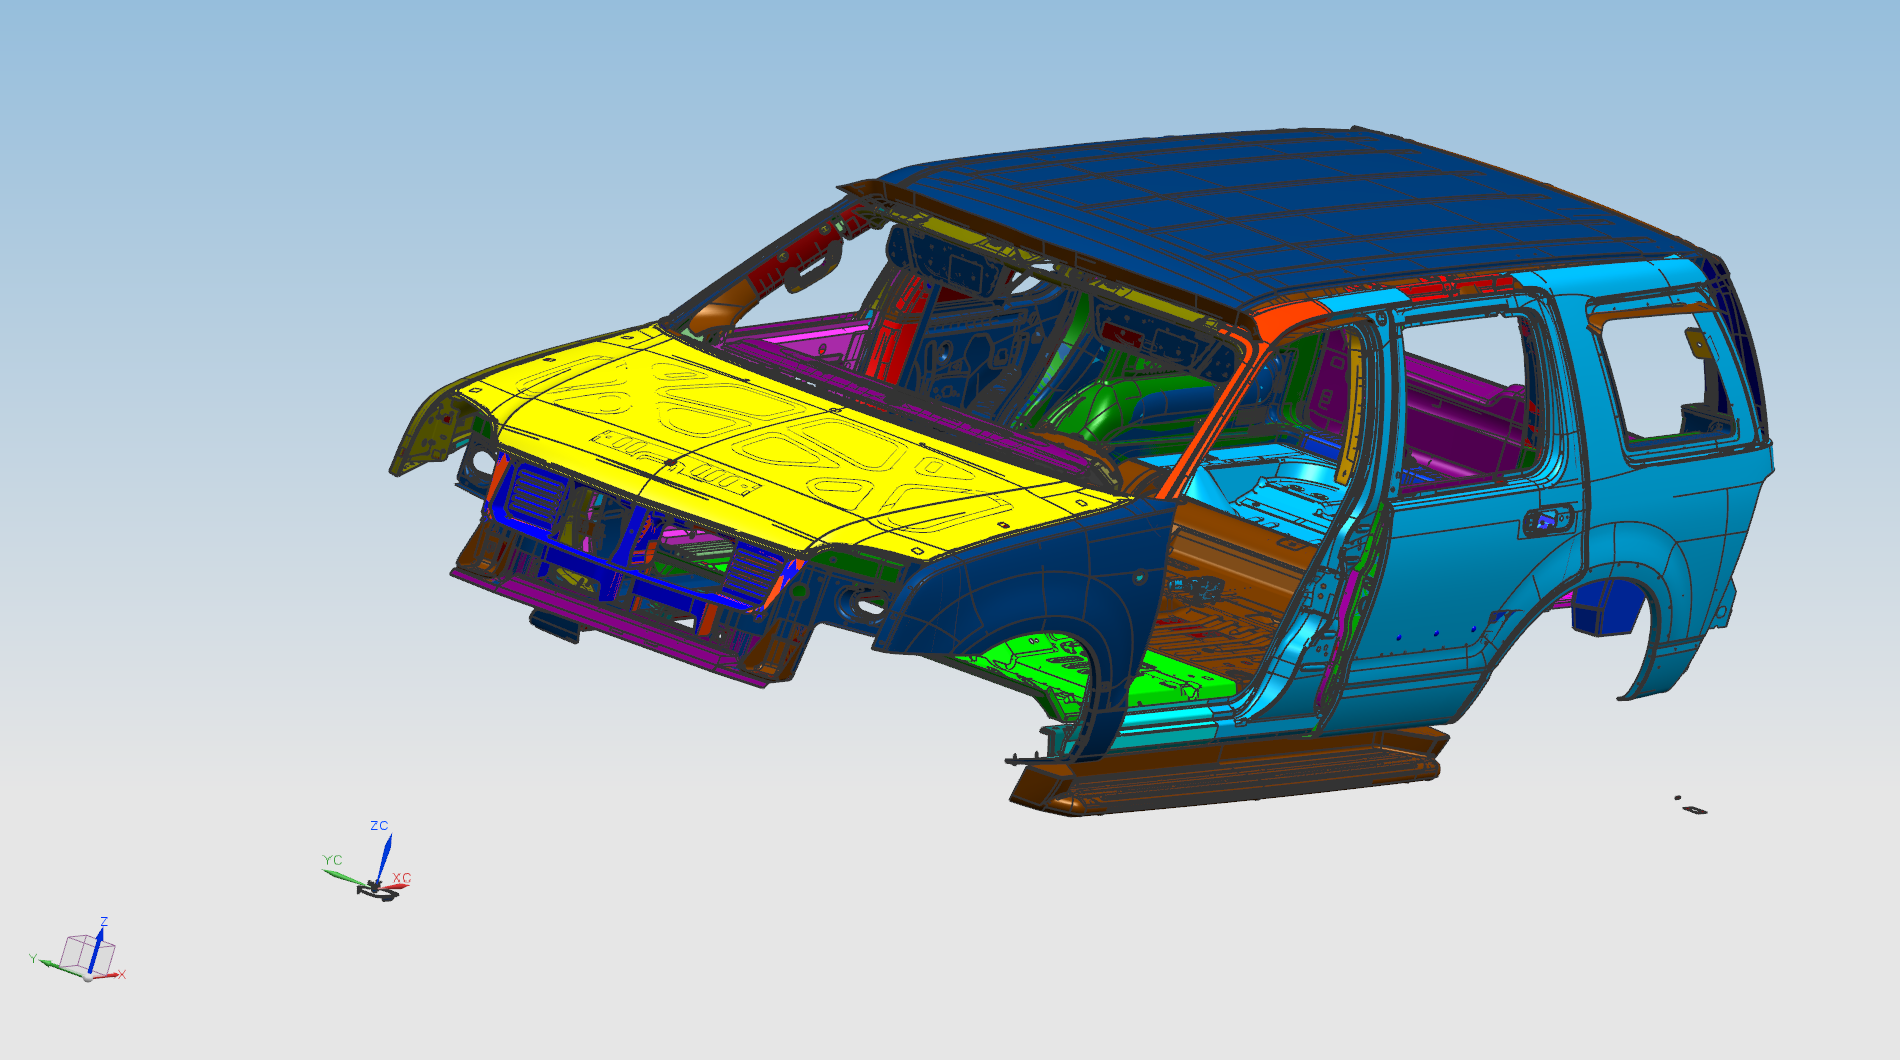
catia-06
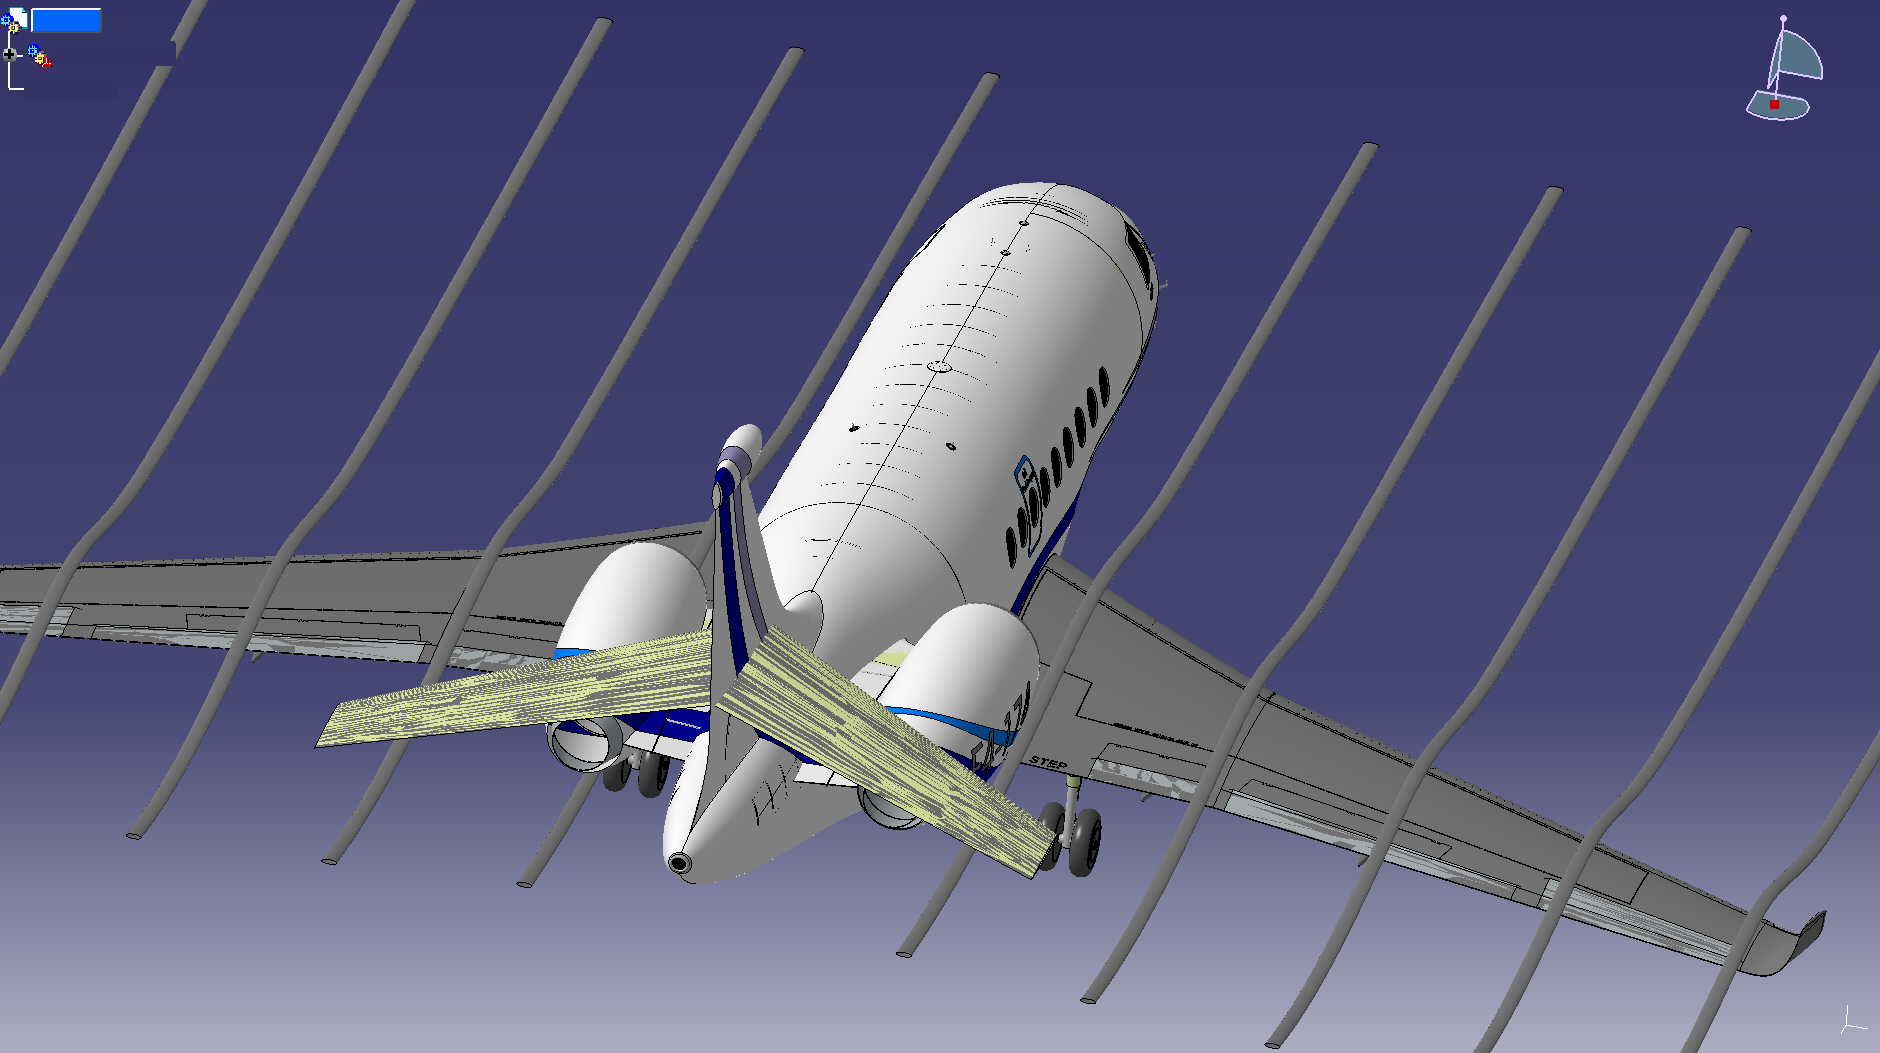
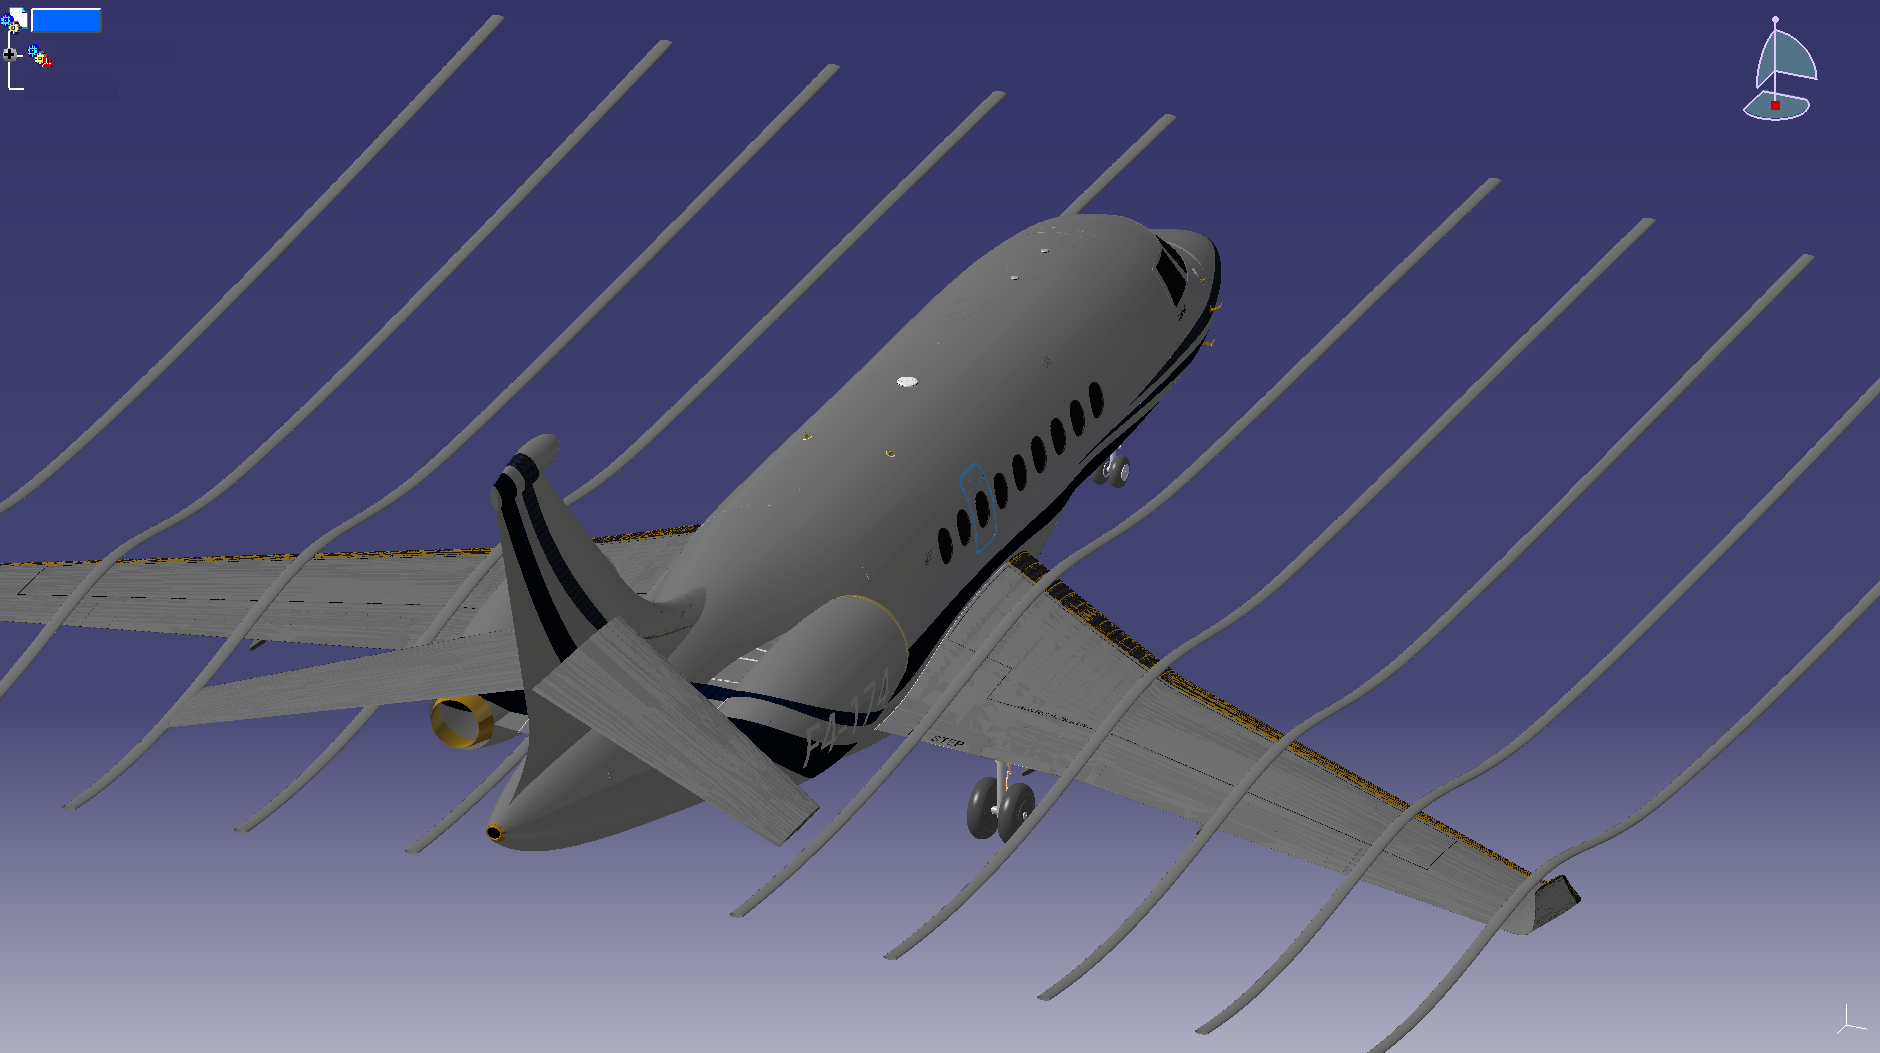
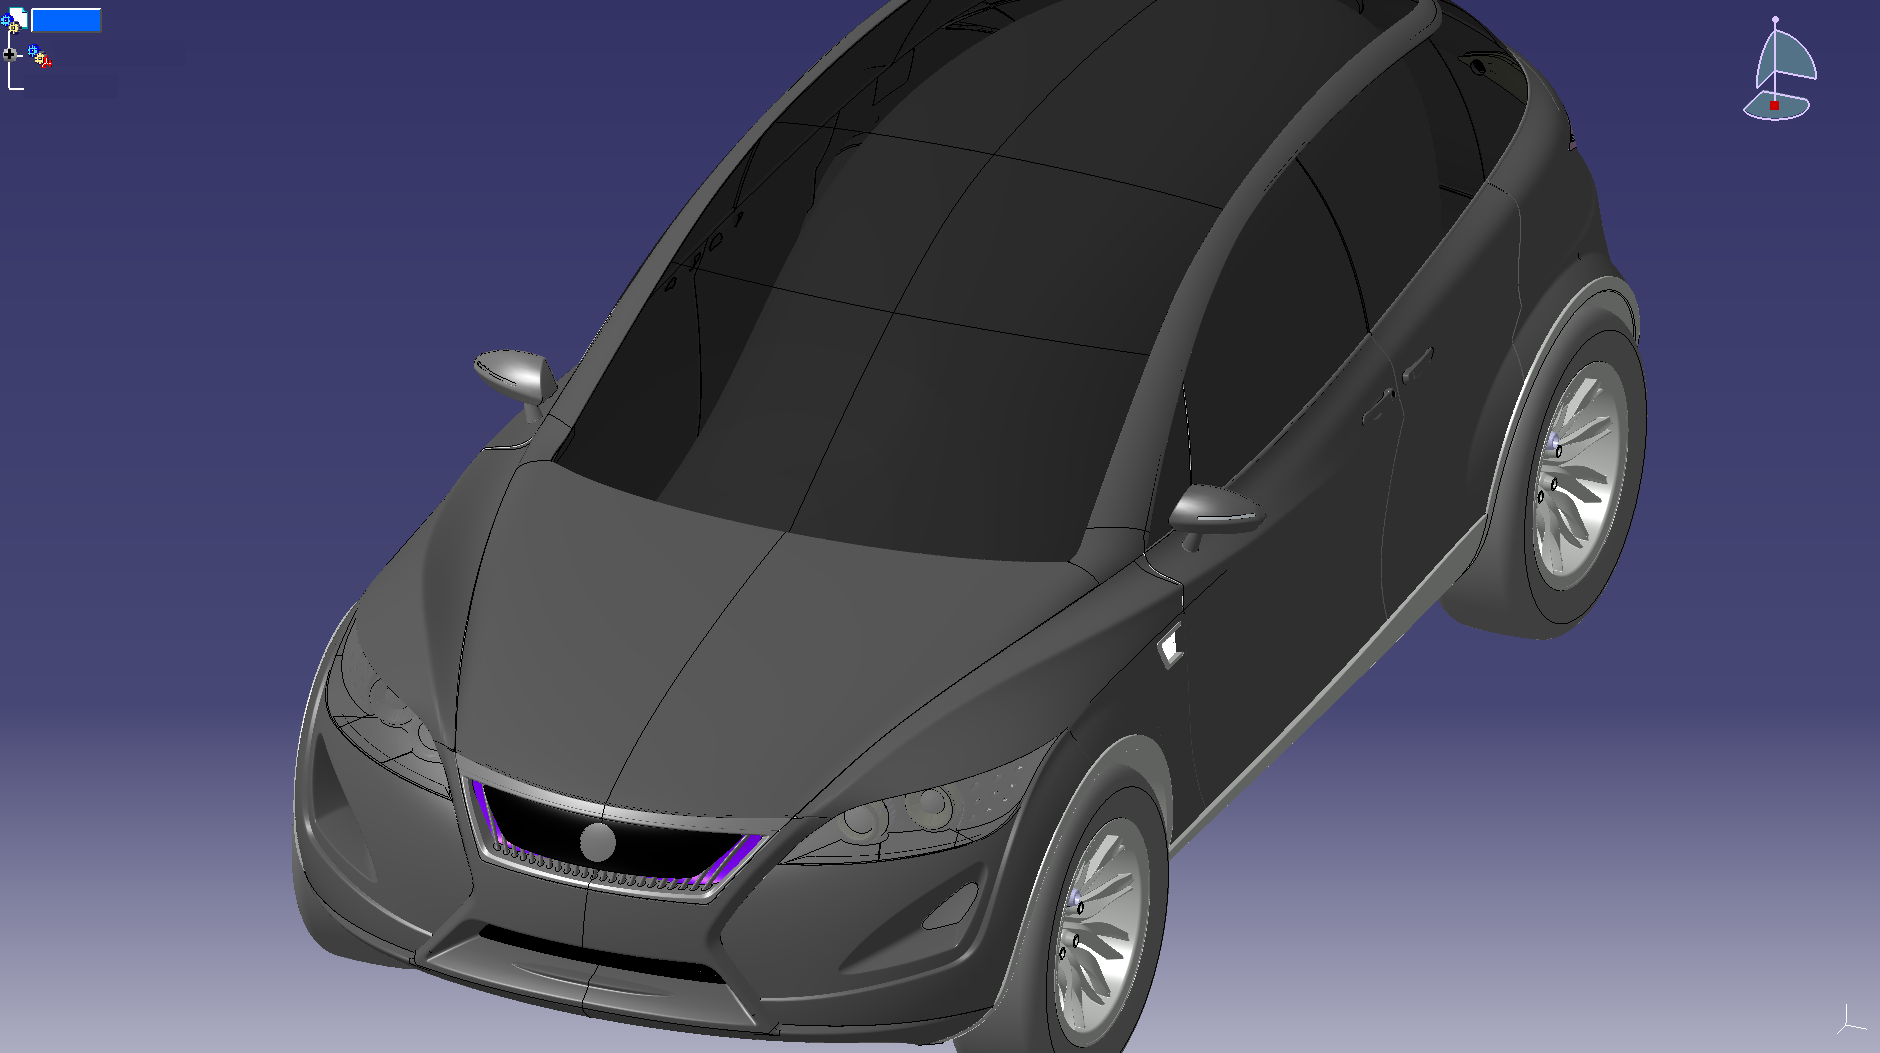
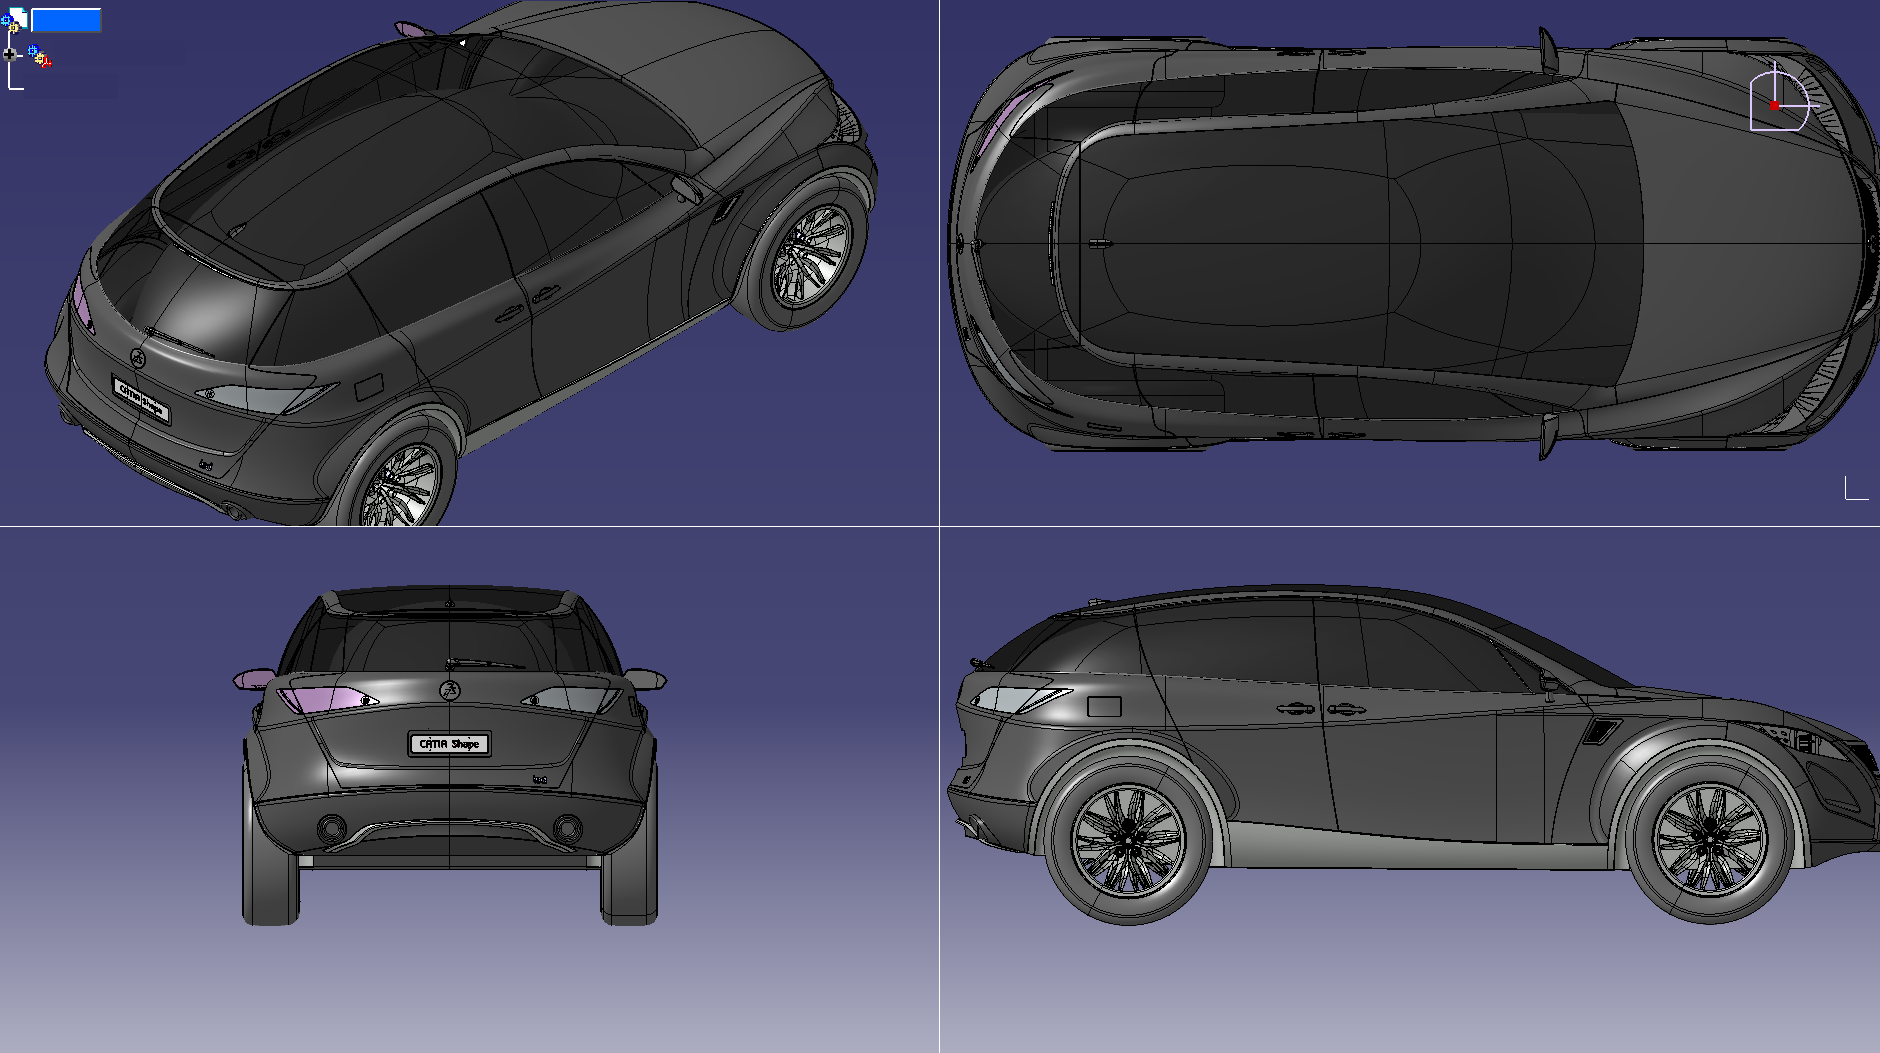
The catia-06 viewset was created from traces of the graphics workload generated by the CATIA V5 and 3DEXPERIENCE CATIA applications from Dassault Systèmes. Model sizes range from 5.1 to 21 million vertices. The viewset includes several rendering modes supported by the application, including anti-aliasing, shaded, and shaded with edges.
catia-06 composite score: 155.11
The composite score is a weighted geometric mean of the subtest scores. See the table below for subtest weights and FPS scores for this run.
Subtest results
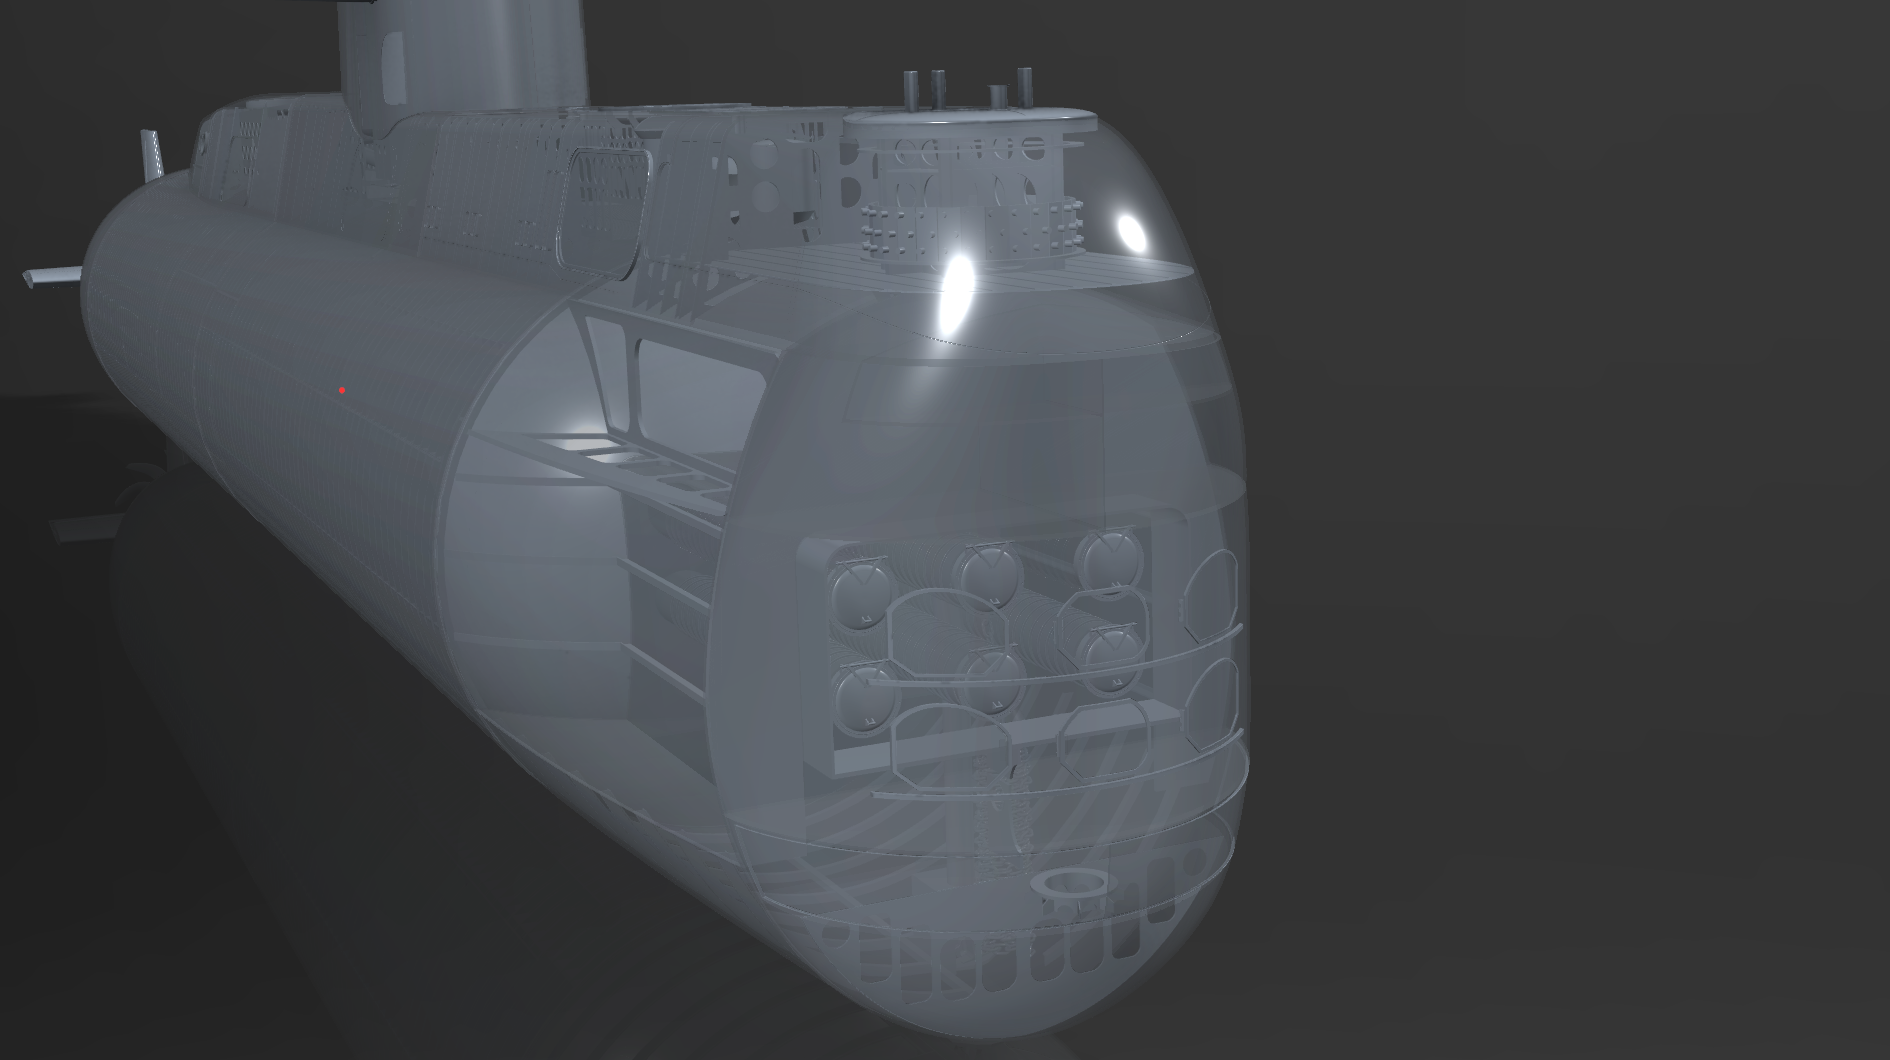
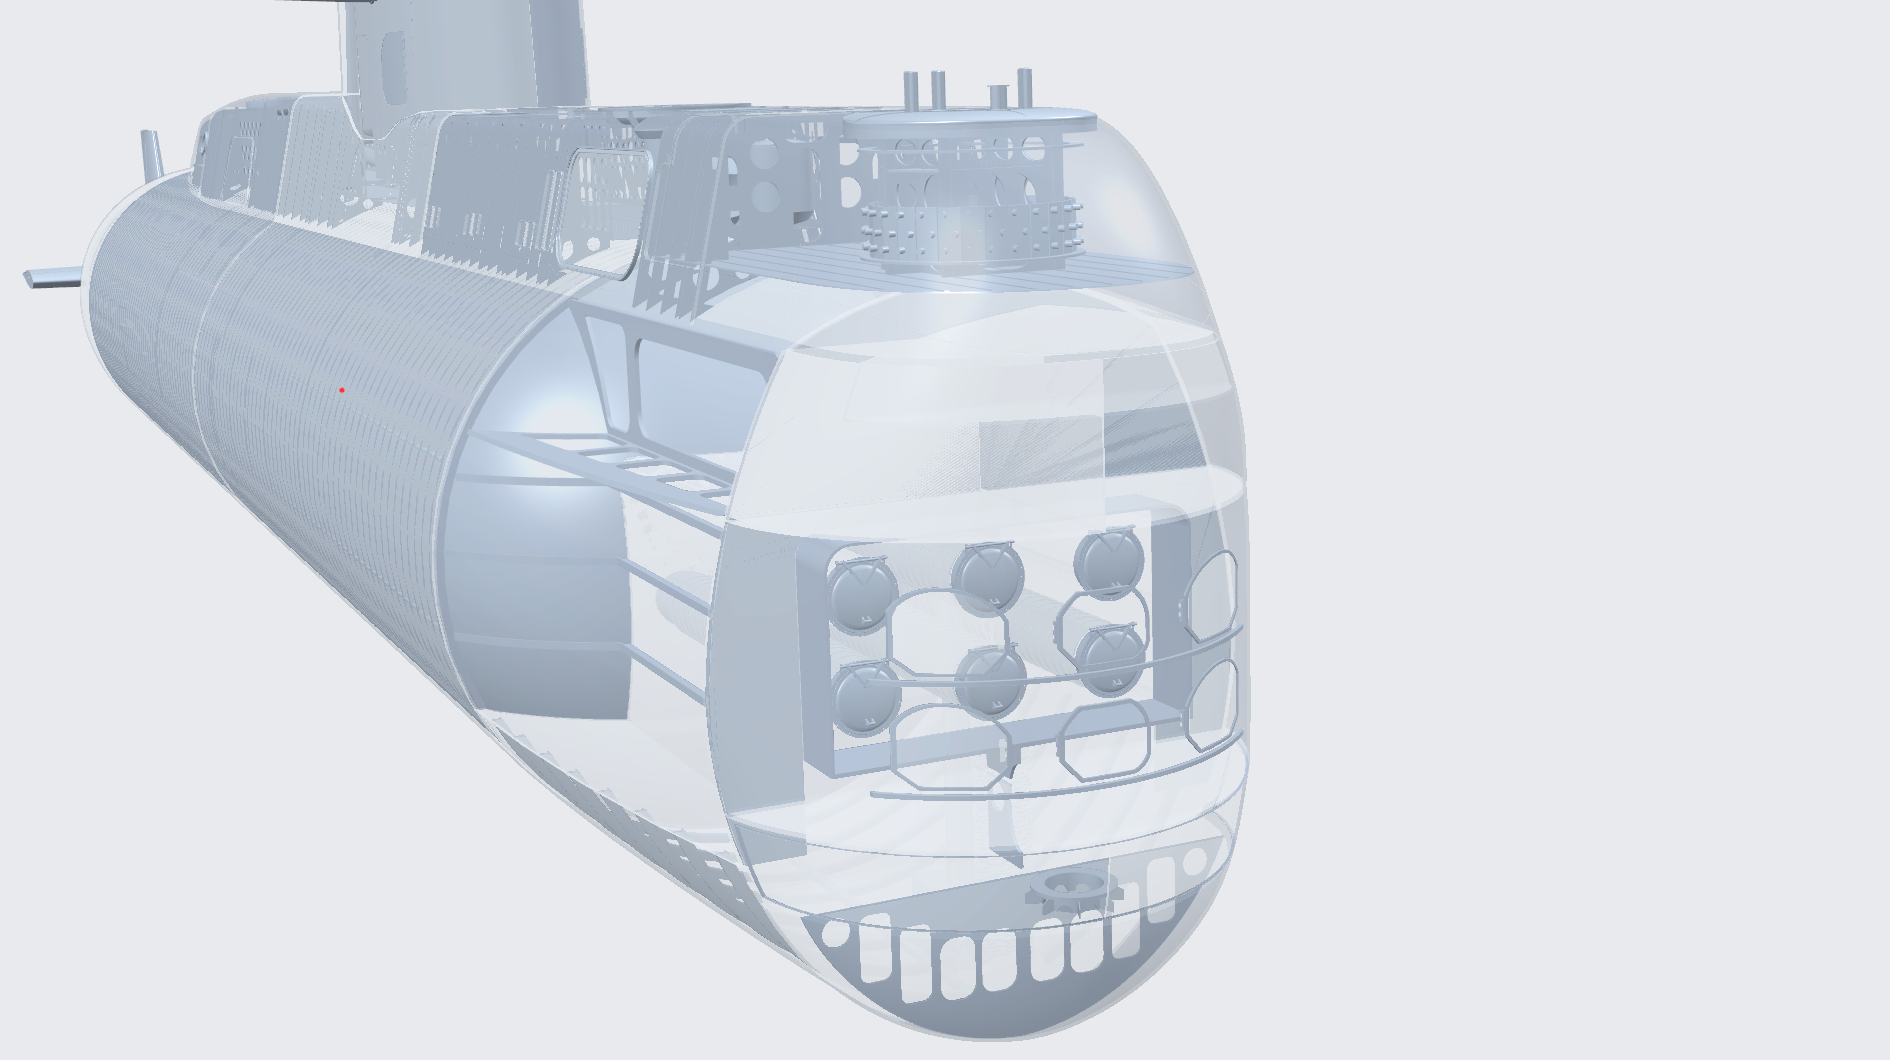
Click on each thumbnail image below to display the subtest's screen grab.
The results table above includes the details about each test within a viewset. Viewsets are often comprised of many tests which produce a frame rate. Frame rate is computed as the average Frames Per Second (FPS), or the total number of frames rendered divided by the time in seconds to render those frames. These FPS values are then used to compute the composite score using the weights for each test.
Screen Grabs Folder
Text Log File
XML Result File
creo-03
The creo-03 viewset was created from traces of the graphics workload generated by the Creo 4™ application from PTC. Model sizes range from 20 to 48 million vertices. The viewsets include numerous rendering modes supported by the application. Order-independent transparency is enabled for all models with transparent components.
creo-03 composite score: 202.65
The composite score is a weighted geometric mean of the subtest scores. See the table below for subtest weights and FPS scores for this run.
Subtest results
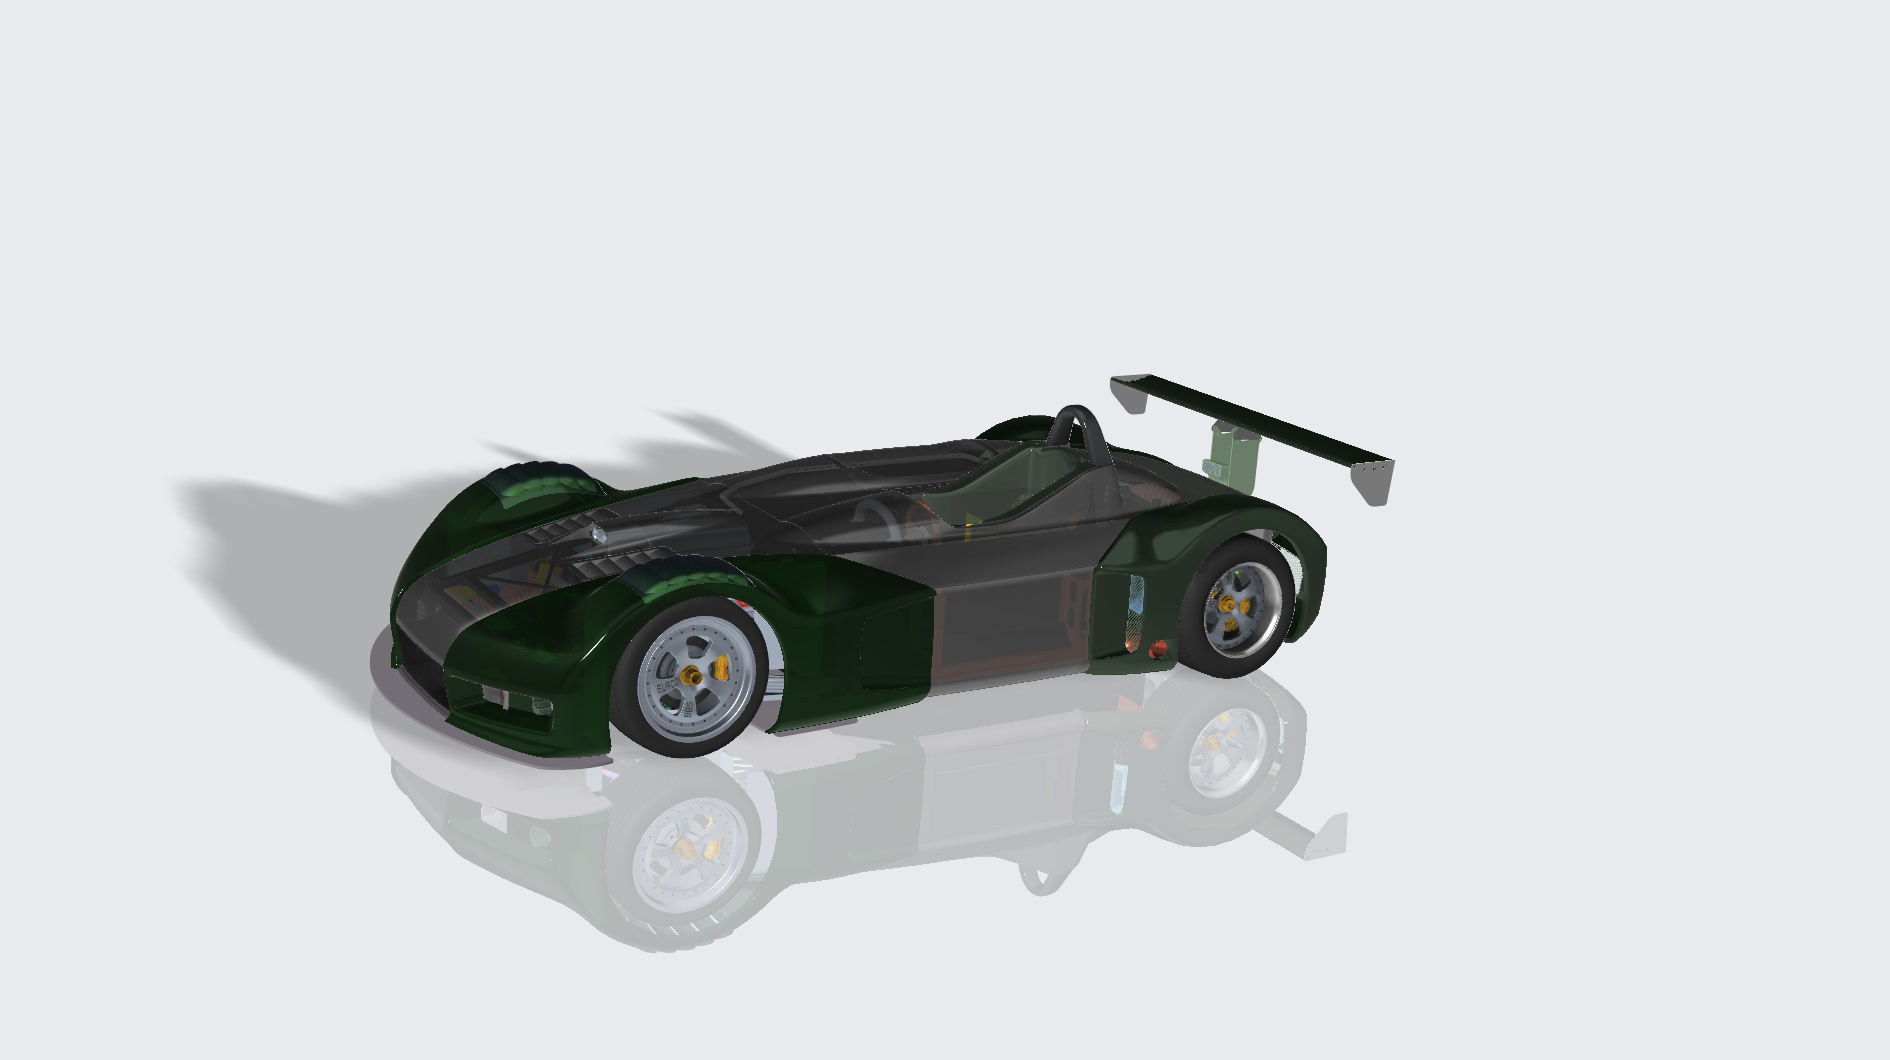
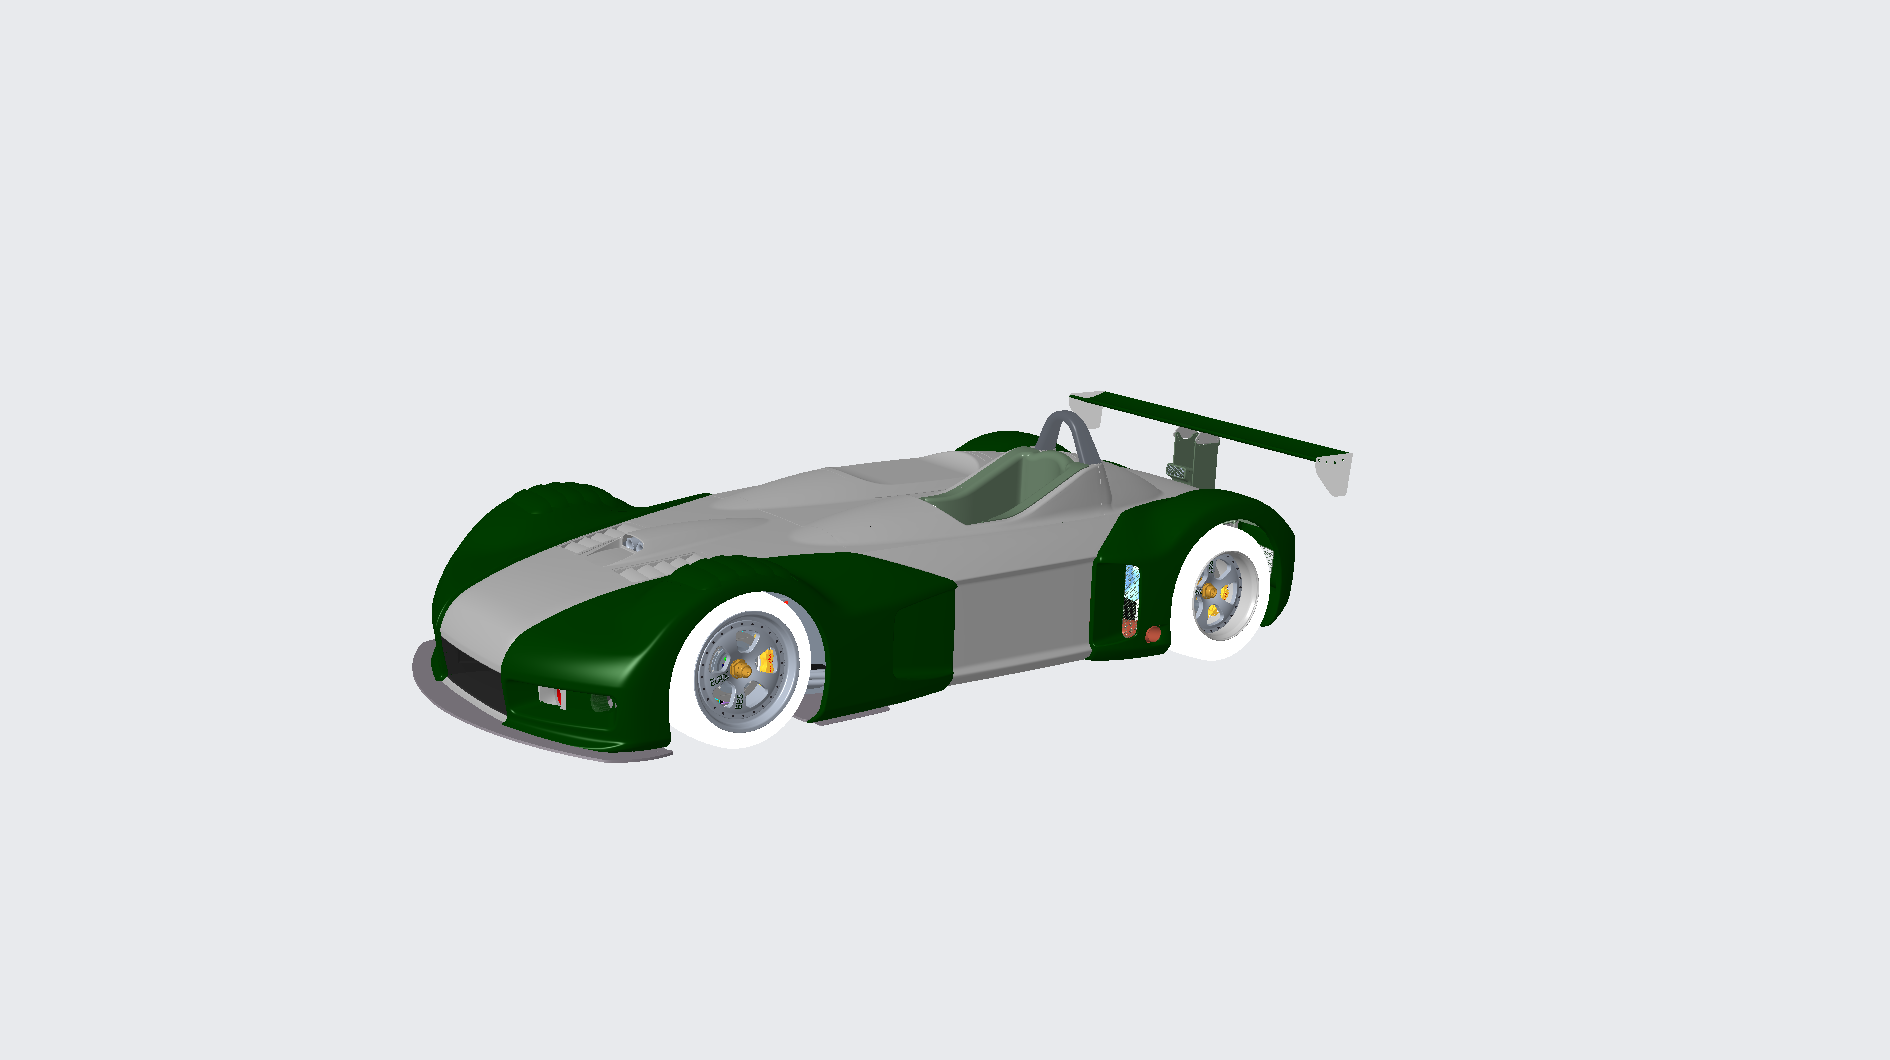
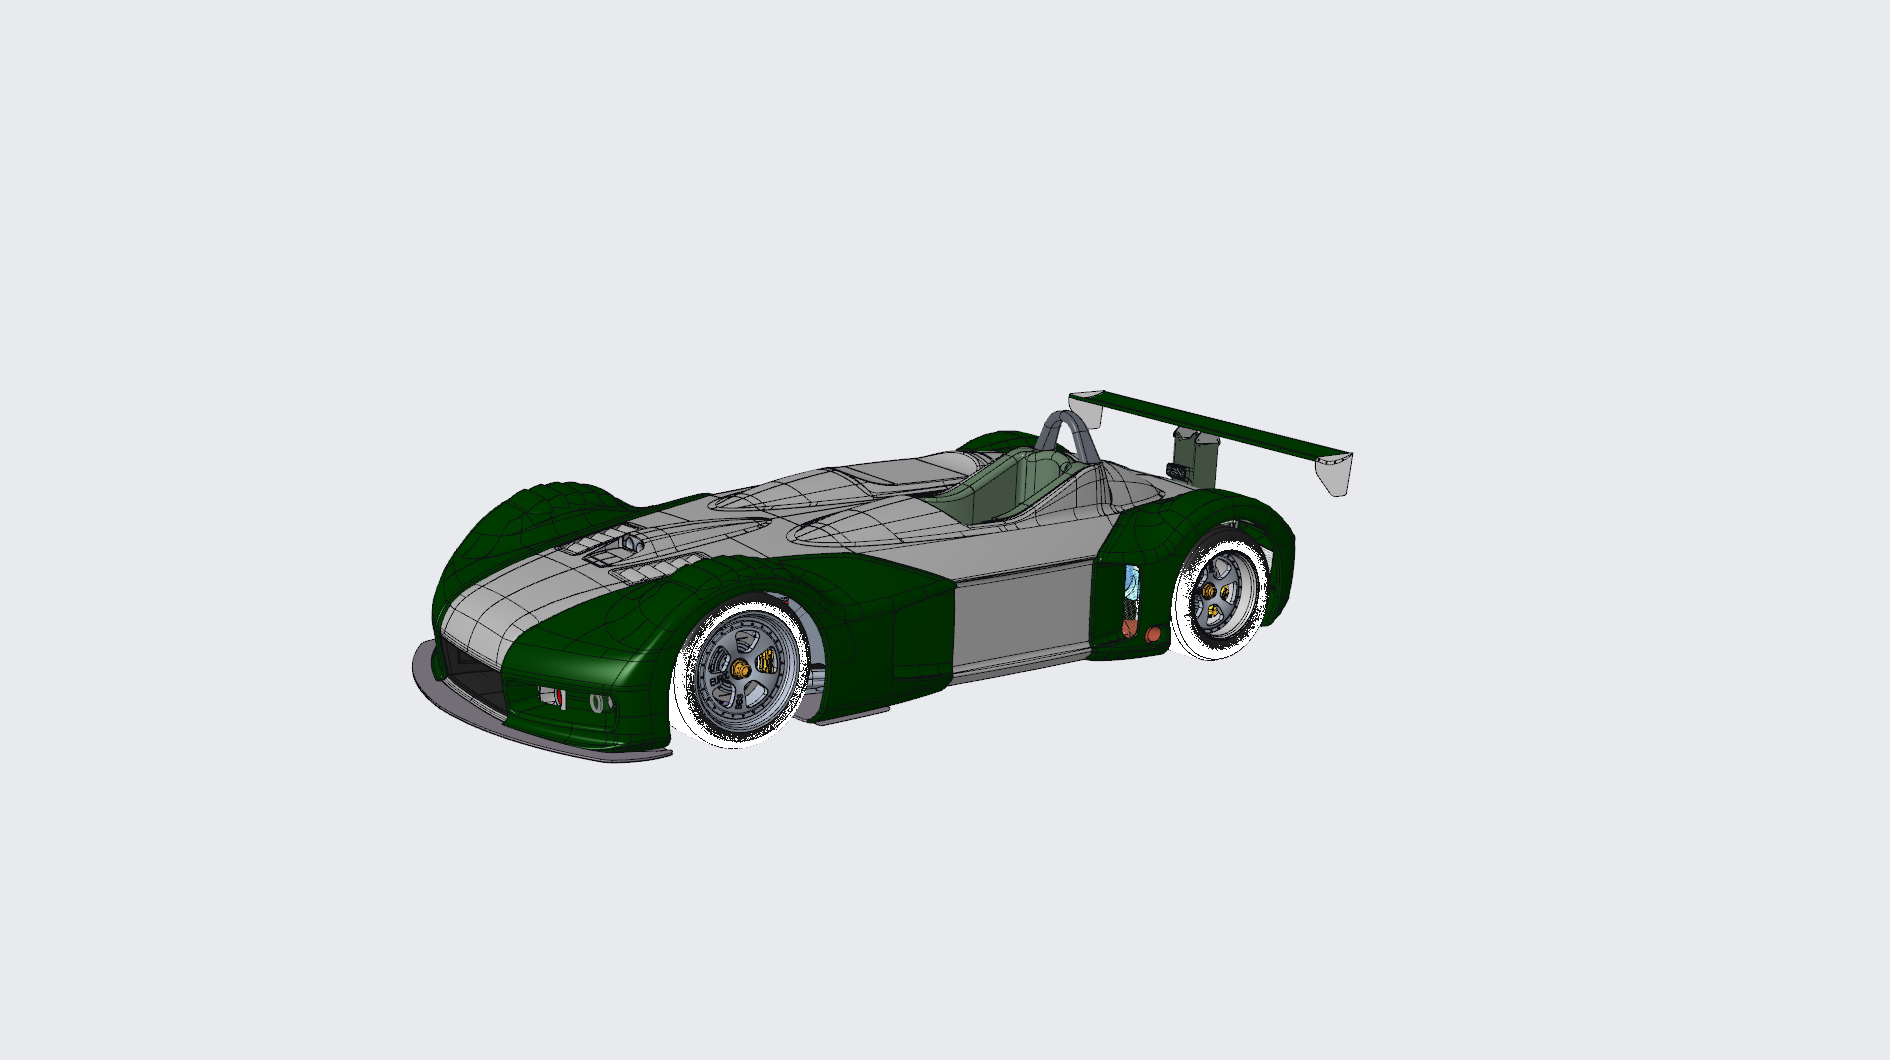
Click on each thumbnail image below to display the subtest's screen grab.
The results table above includes the details about each test within a viewset. Viewsets are often comprised of many tests which produce a frame rate. Frame rate is computed as the average Frames Per Second (FPS), or the total number of frames rendered divided by the time in seconds to render those frames. These FPS values are then used to compute the composite score using the weights for each test.
Screen Grabs Folder
Text Log File
XML Result File
energy-03
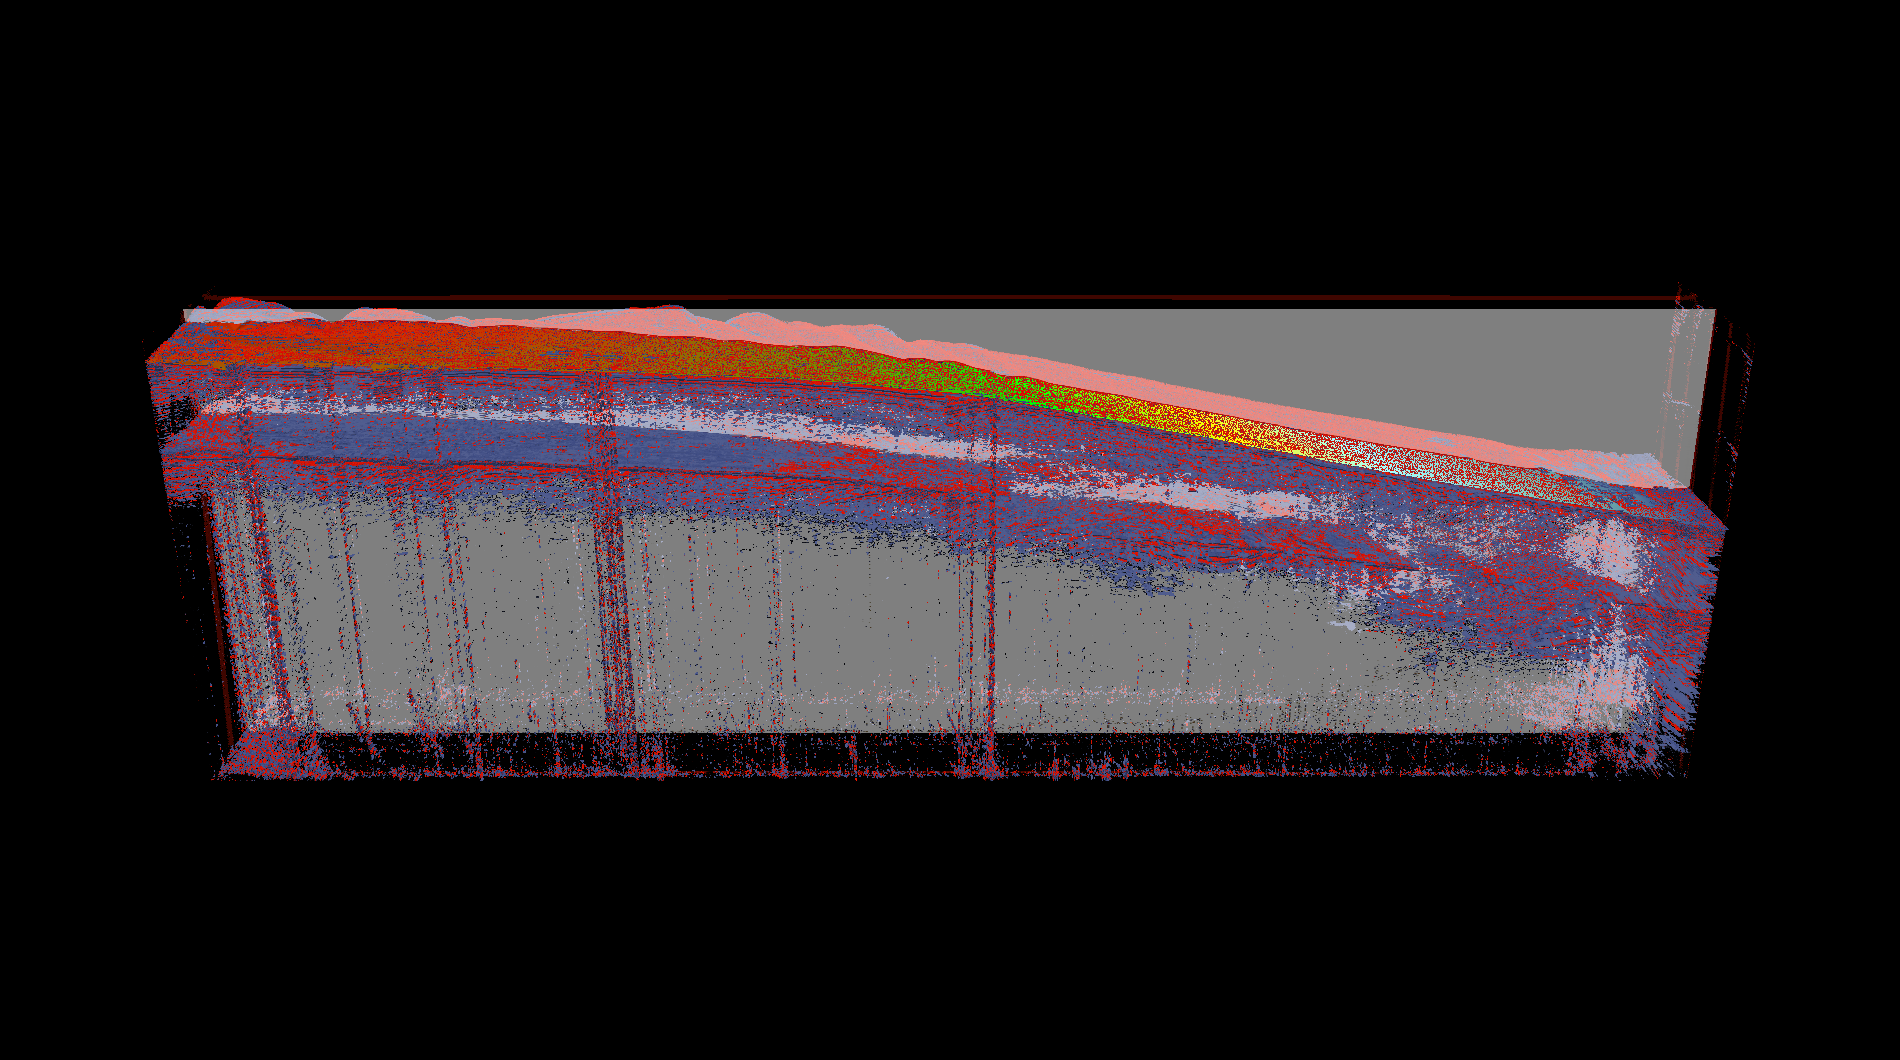
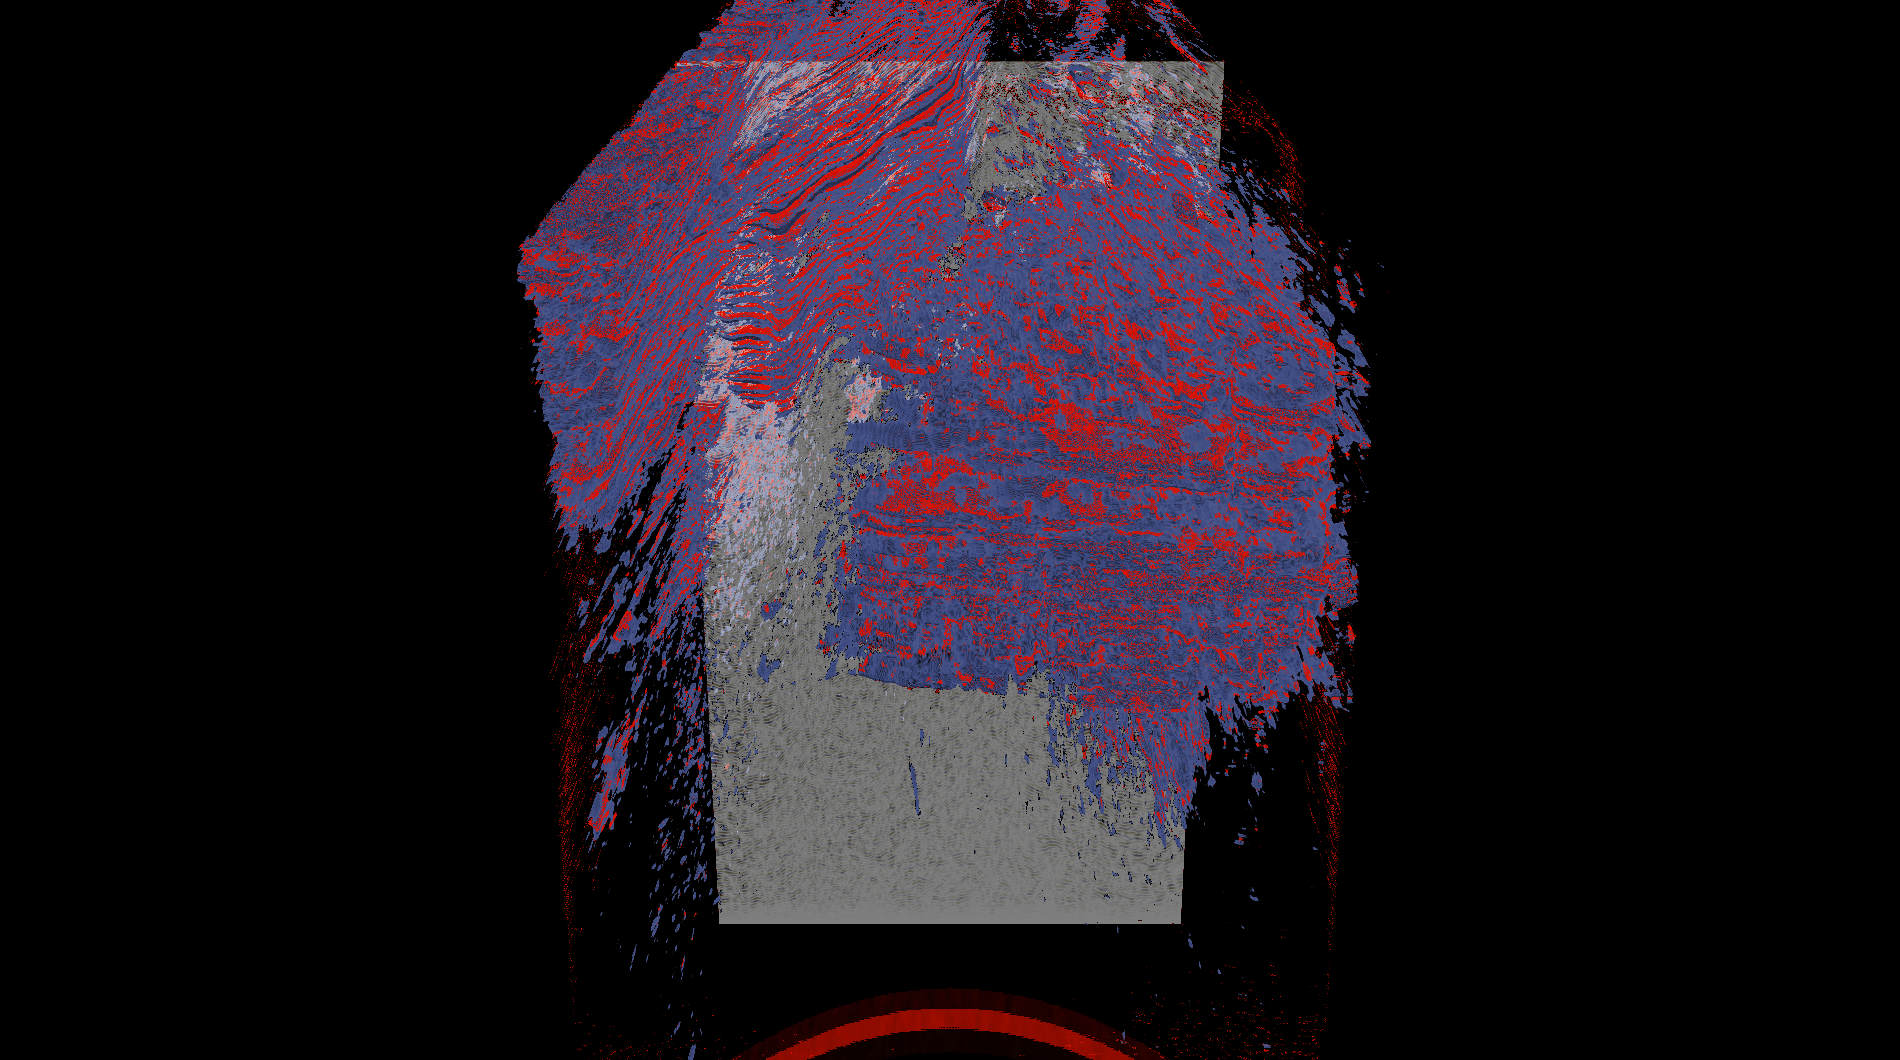
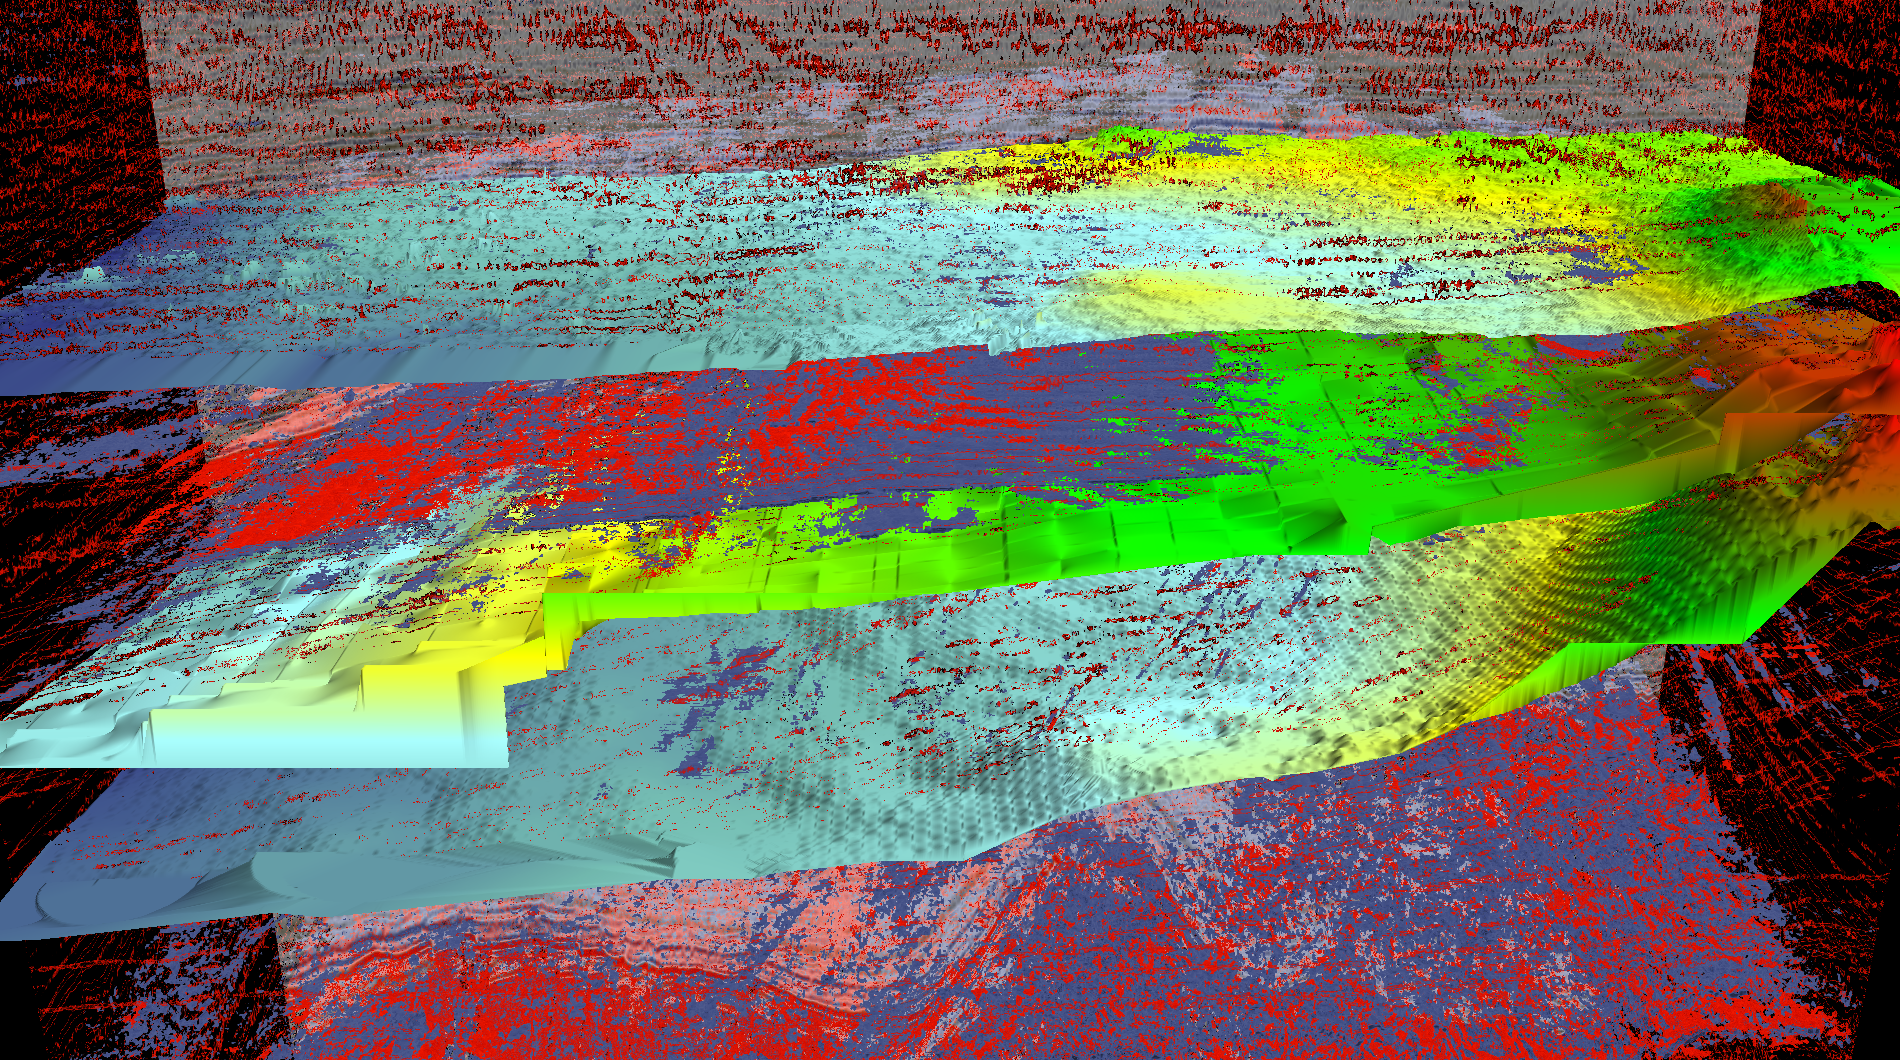
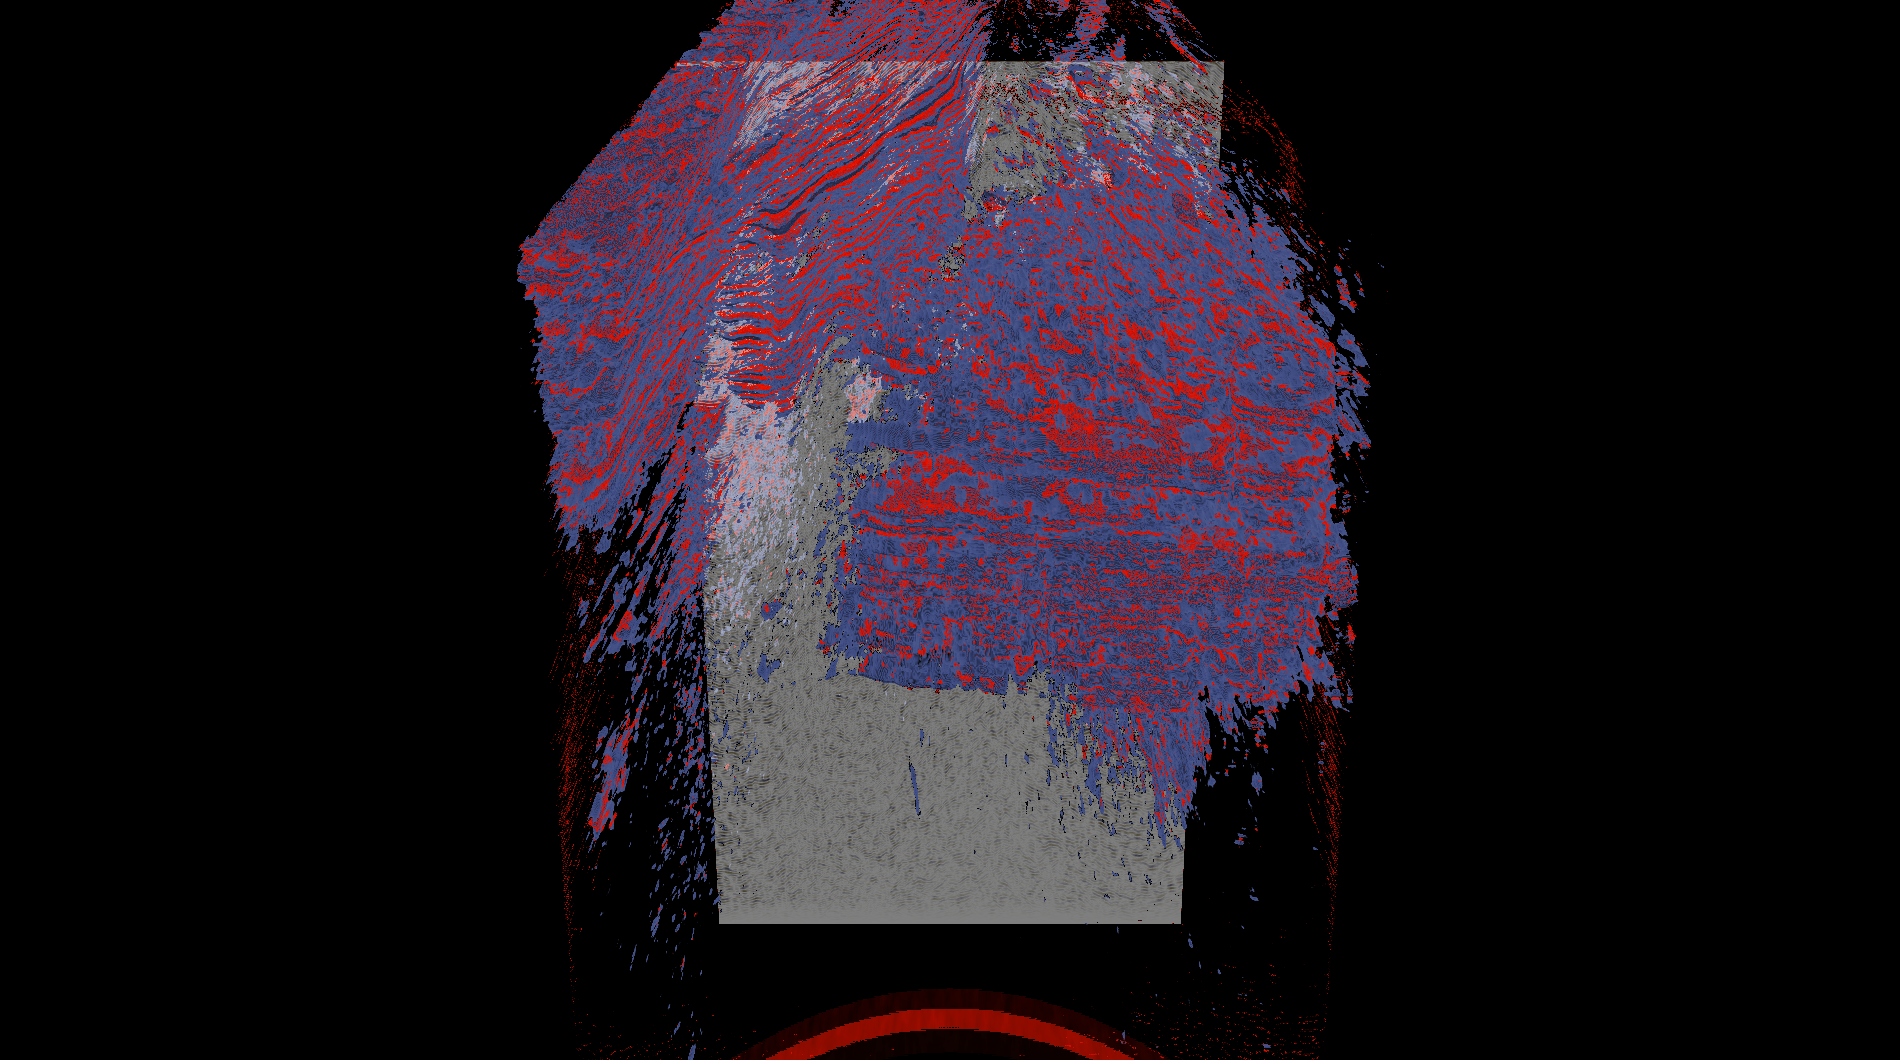
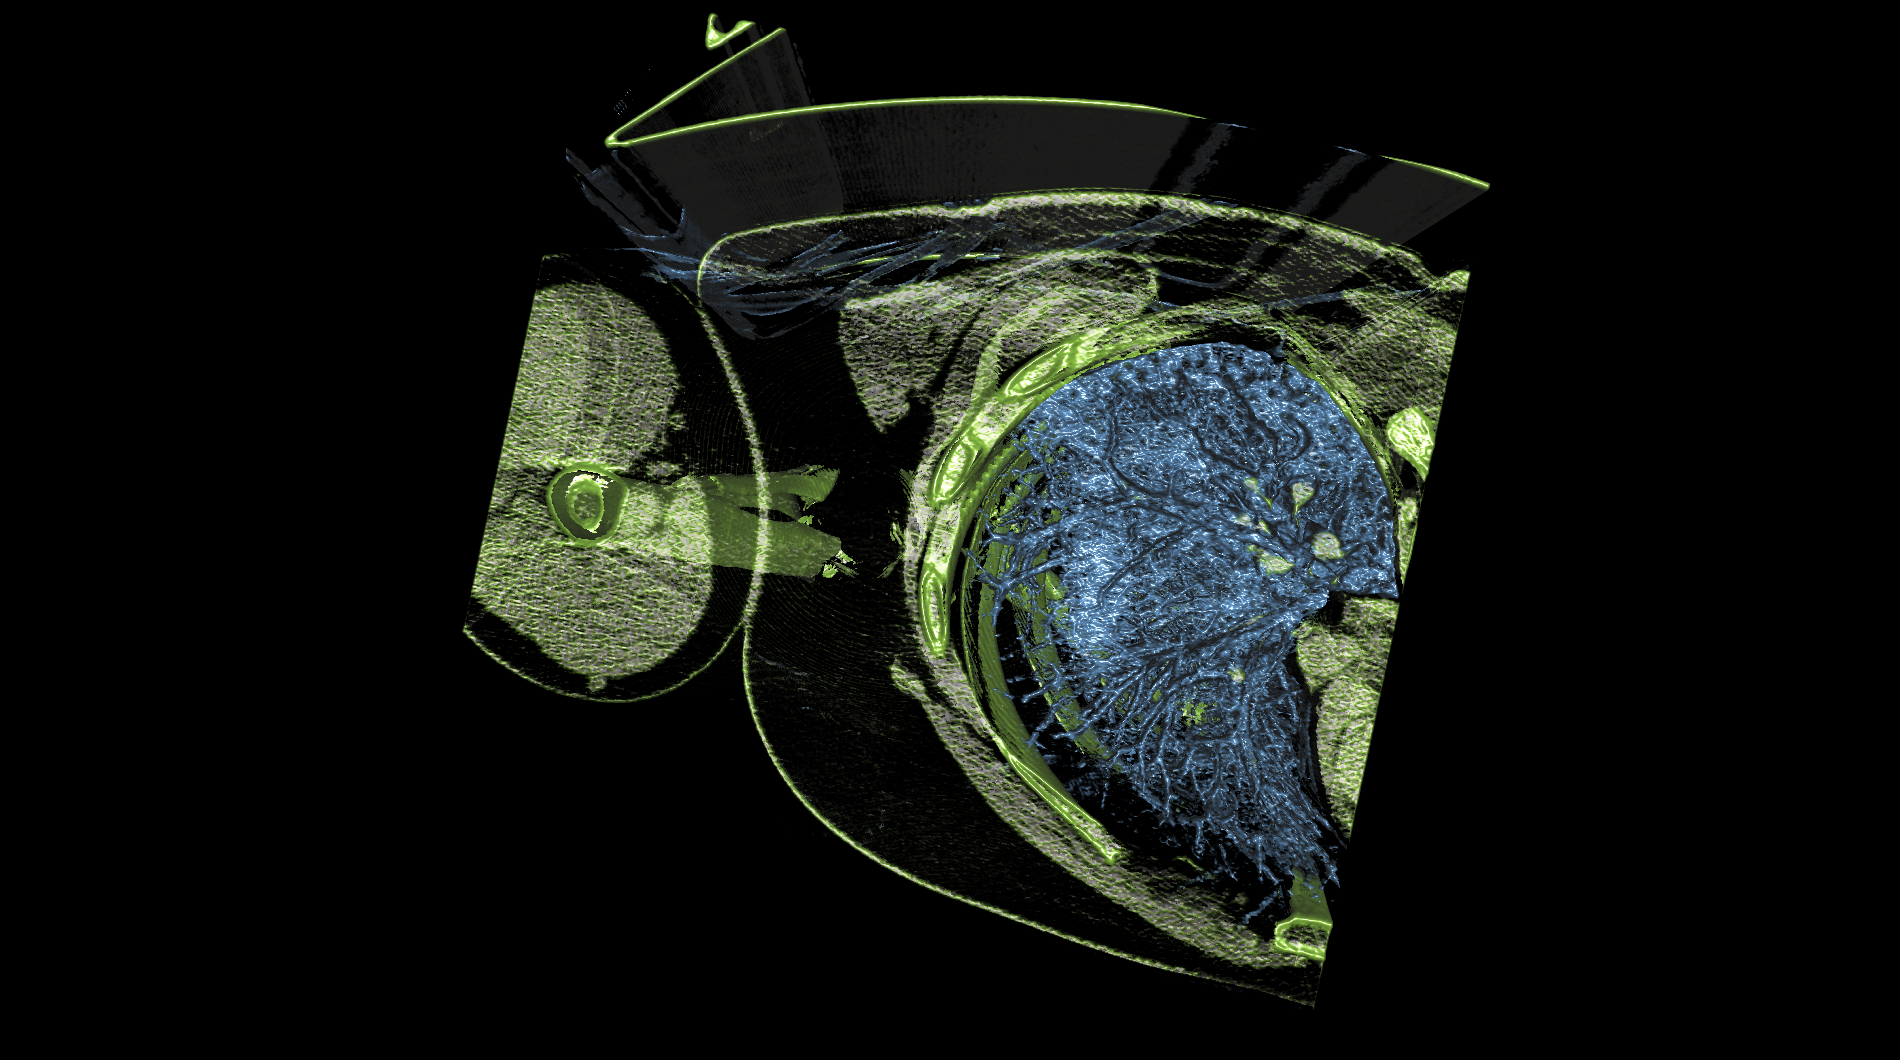
The energy-03 viewset is based on rendering techniques used by the open-source OpendTect seismic visualization application. Similar to medical imaging such as MRI or CT, geophysical surveys generate image slices through the subsurface that are built into a 3D grid. Volume rendering provides a 2D projection of this 3D volumetric grid for further analysis and interpretation. In addition to the volume rendering, the test includes both inline and crossline planes (slices in the X and Y planes). Also, for some subtests, “horizons” are present – these are geological strata boundaries of interest, generated by exploration geophysicists, and are rendered using textured triangle strips. The 3D datasets used in this viewset are real-world seismic datasets found at https://wiki.seg.org/wiki/Open_data". They were translated from their native SEG-Y format and compressed using JPEG-2000. Note: subtests 3 and 6 will have a score of 0.01 on GPUs with less than 3584MB (3.5GB) of framebuffer memory.
energy-03 composite score: 123.68
The composite score is a weighted geometric mean of the subtest scores. See the table below for subtest weights and FPS scores for this run.
Subtest results
Click on each thumbnail image below to display the subtest's screen grab.
The results table above includes the details about each test within a viewset. Viewsets are often comprised of many tests which produce a frame rate. Frame rate is computed as the average Frames Per Second (FPS), or the total number of frames rendered divided by the time in seconds to render those frames. These FPS values are then used to compute the composite score using the weights for each test.
Screen Grabs Folder
Text Log File
XML Result File
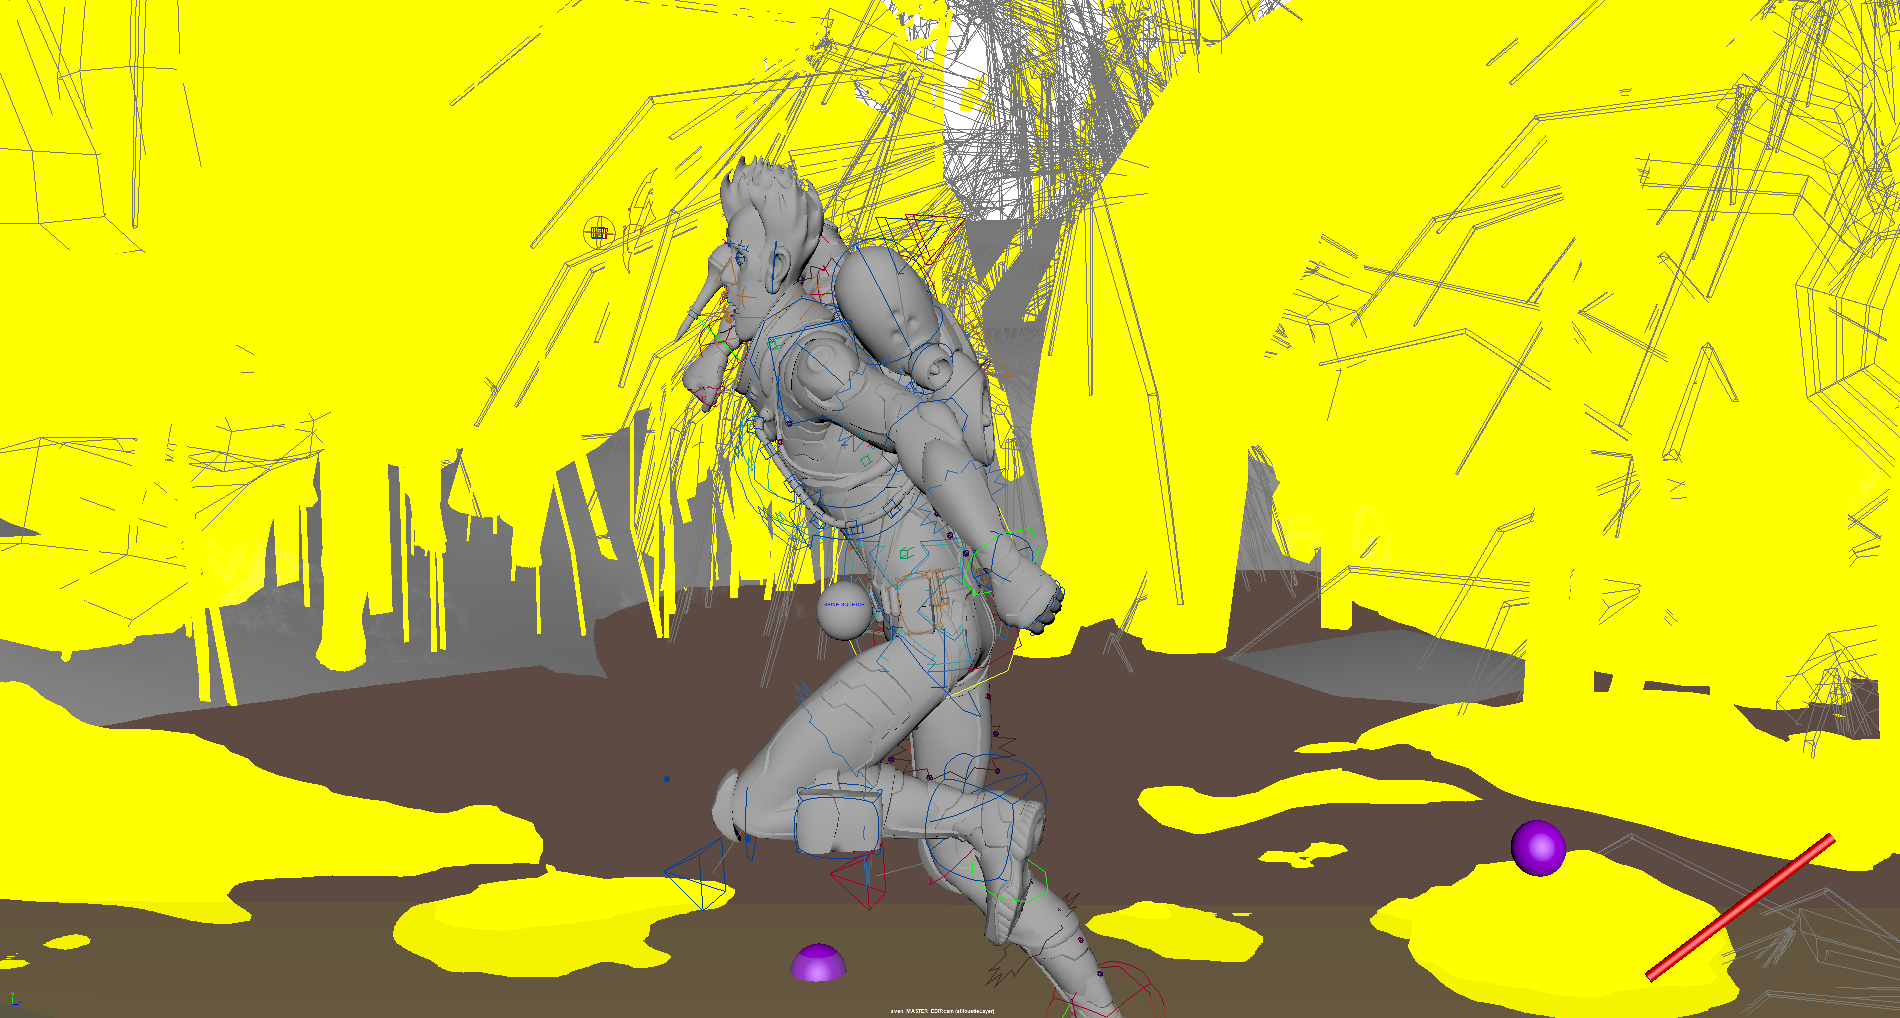
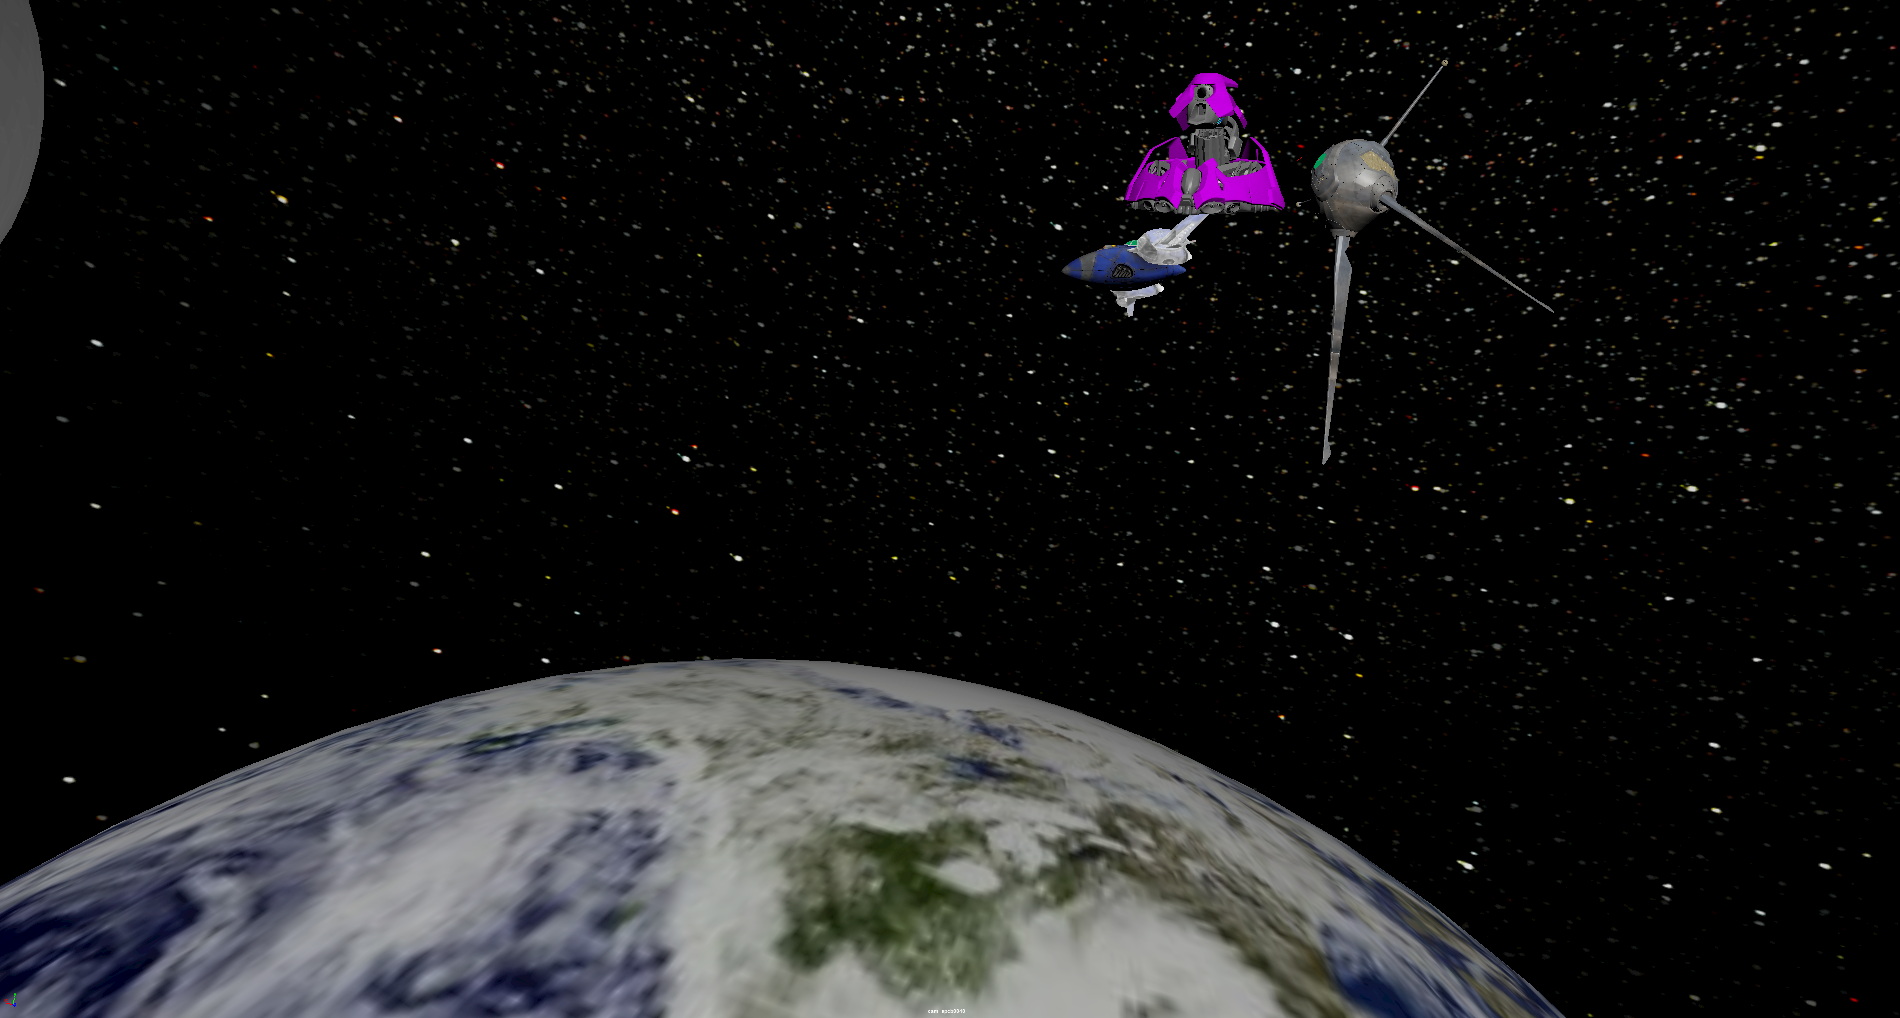
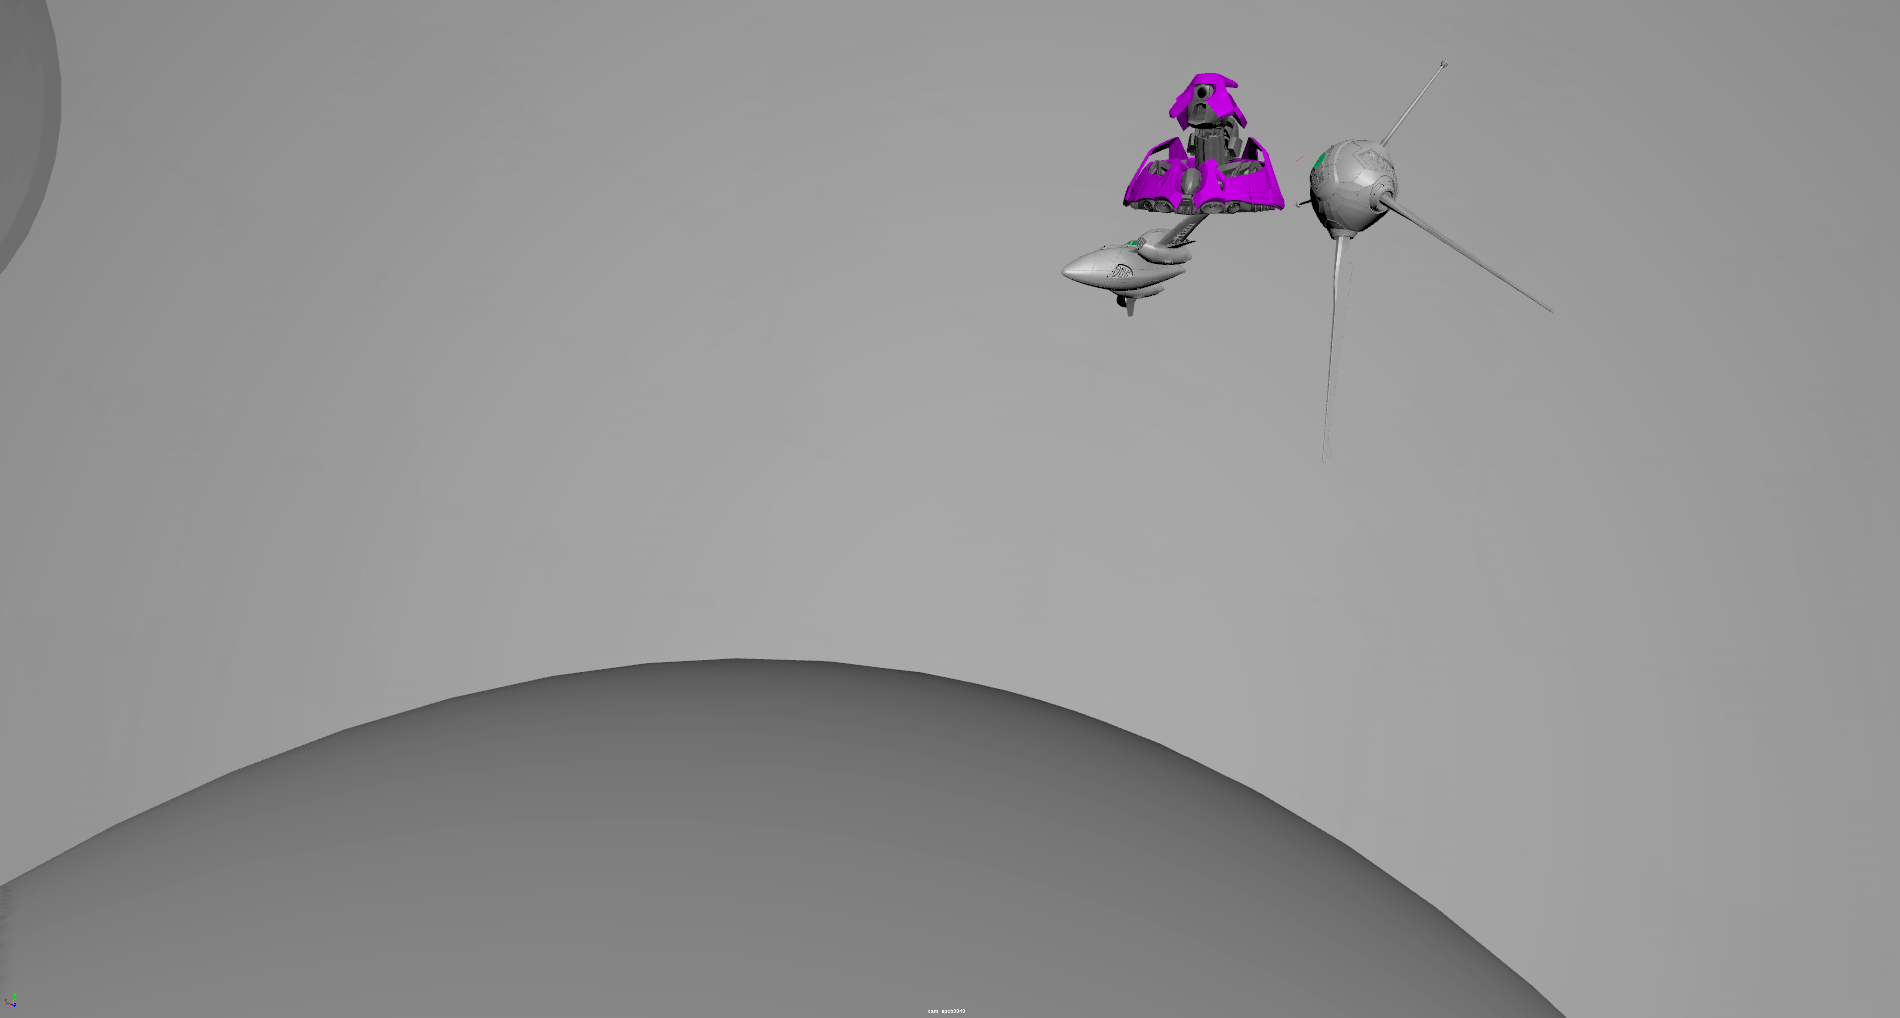
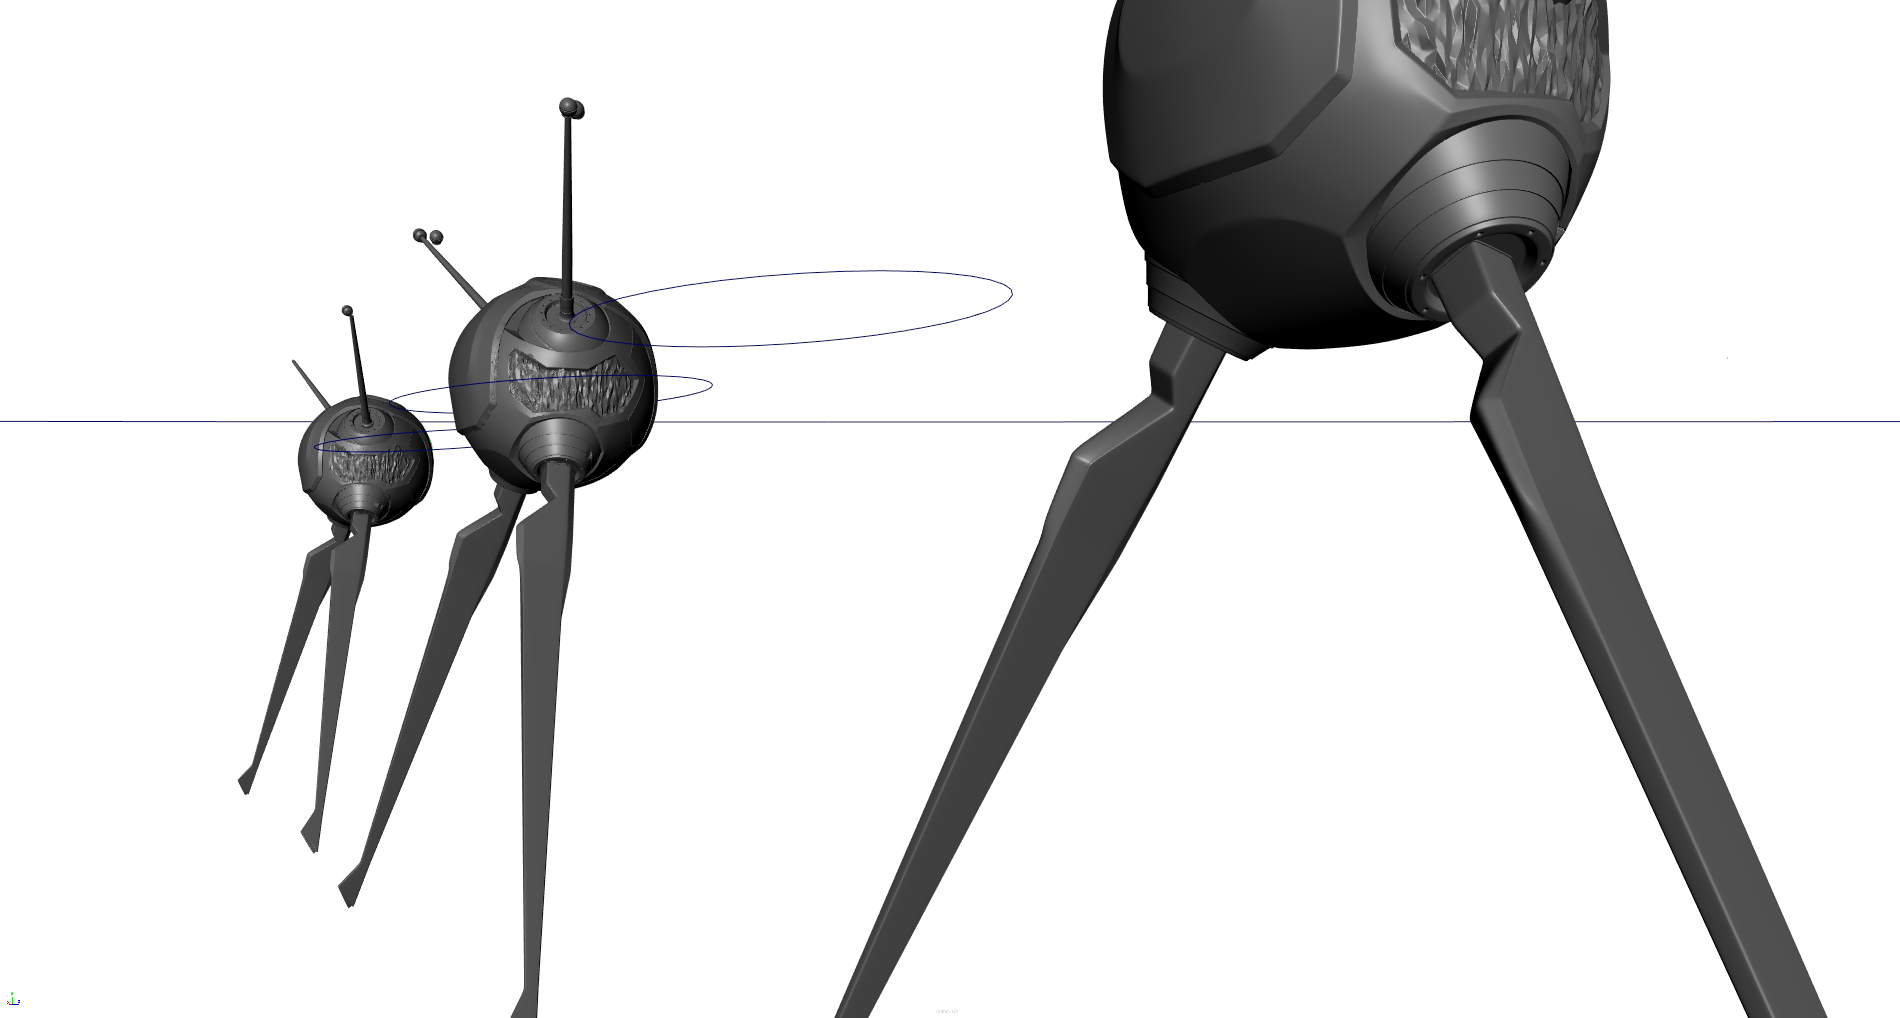
maya-06
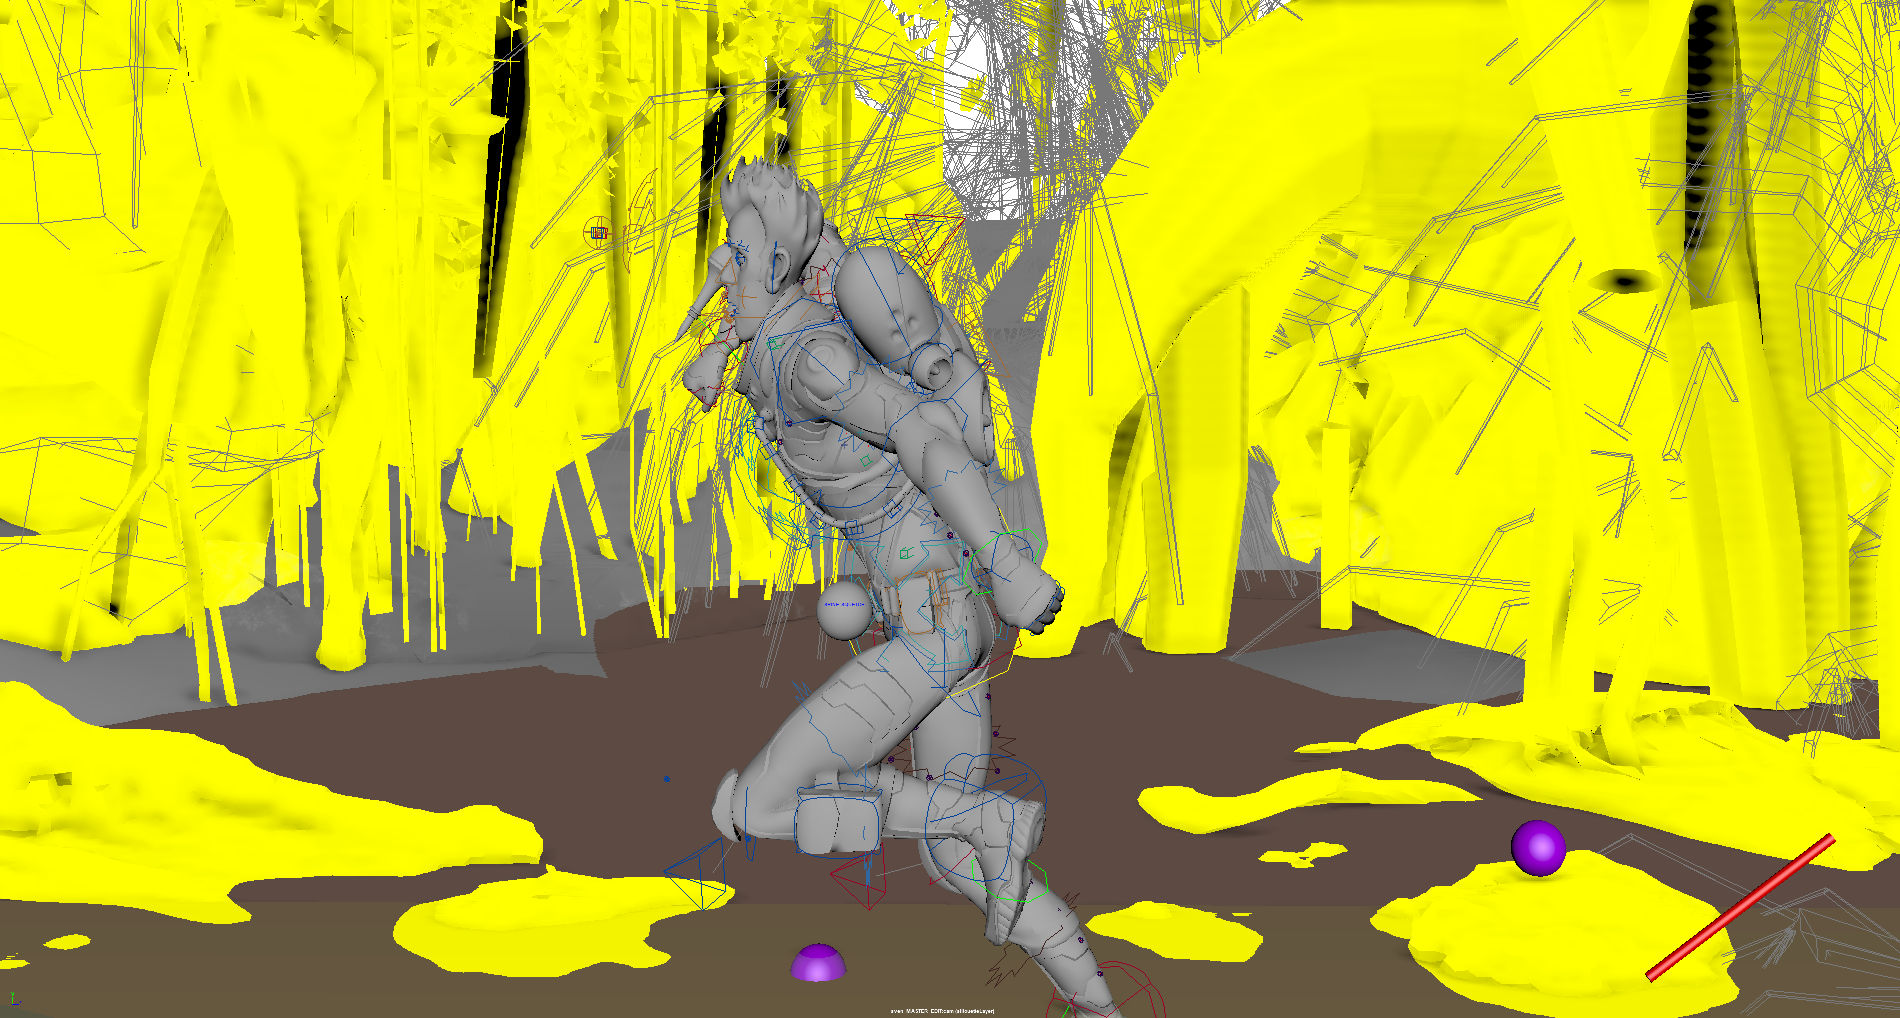
The maya-06 viewset was created from traces of the graphics workload generated by the Maya 2019 application from Autodesk. The viewset includes numerous rendering modes supported by the application, including shaded mode, ambient occlusion, multi-sample antialiasing, and transparency. All tests are rendered using Viewport 2.0.
maya-06 composite score: 573.07
The composite score is a weighted geometric mean of the subtest scores. See the table below for subtest weights and FPS scores for this run.
Subtest results
Click on each thumbnail image below to display the subtest's screen grab.
The results table above includes the details about each test within a viewset. Viewsets are often comprised of many tests which produce a frame rate. Frame rate is computed as the average Frames Per Second (FPS), or the total number of frames rendered divided by the time in seconds to render those frames. These FPS values are then used to compute the composite score using the weights for each test.
Screen Grabs Folder
Text Log File
XML Result File
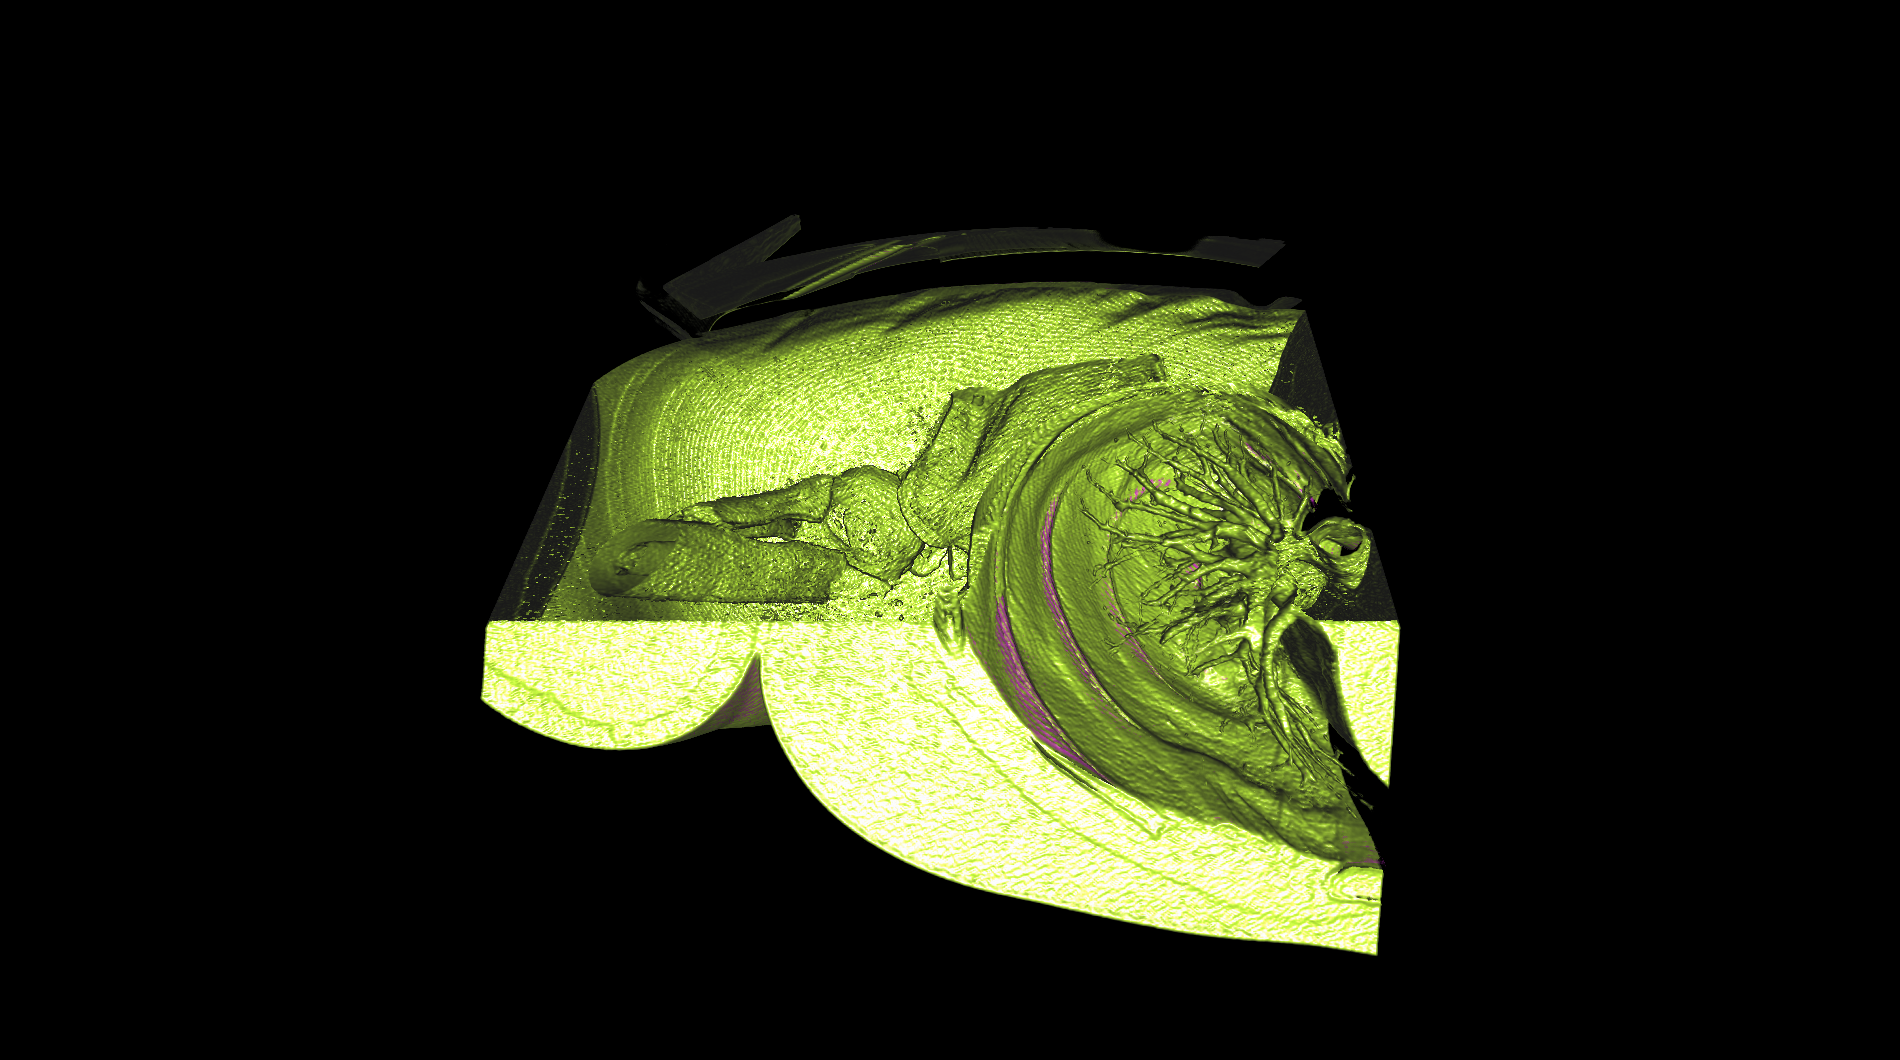
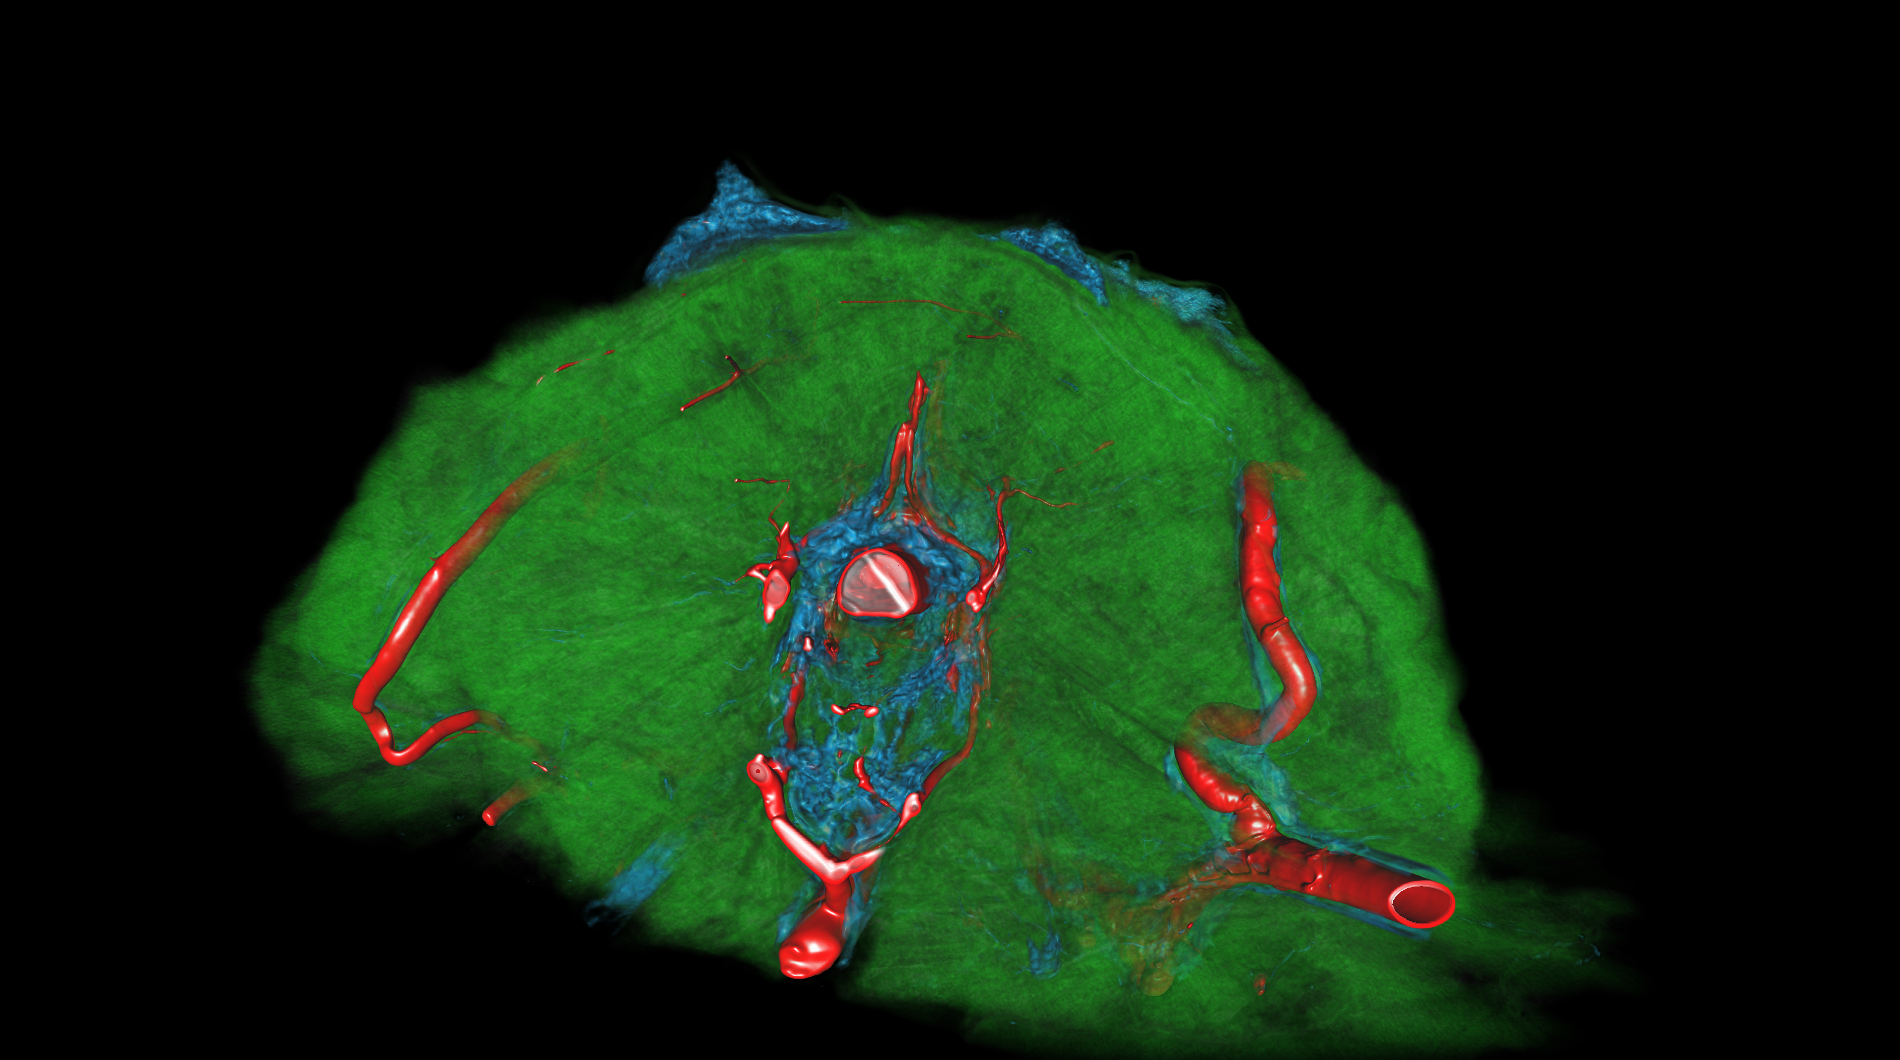
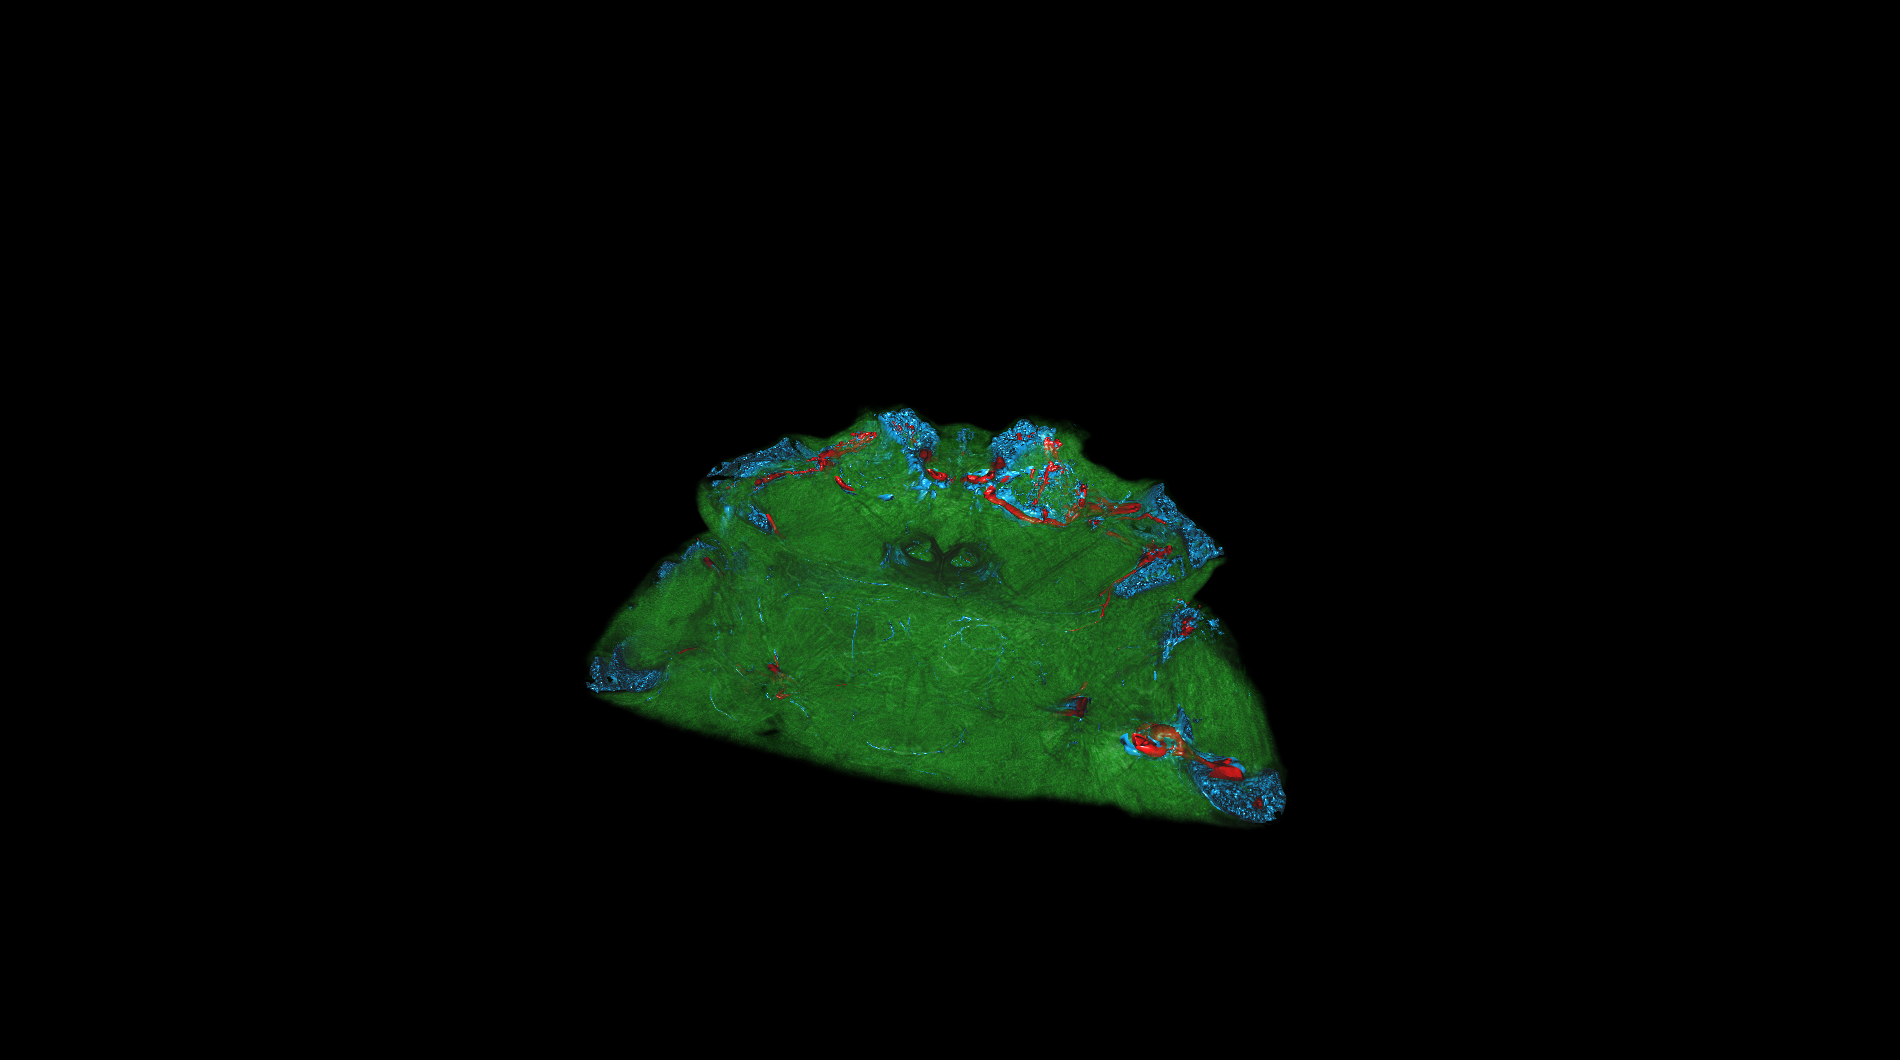
medical-03
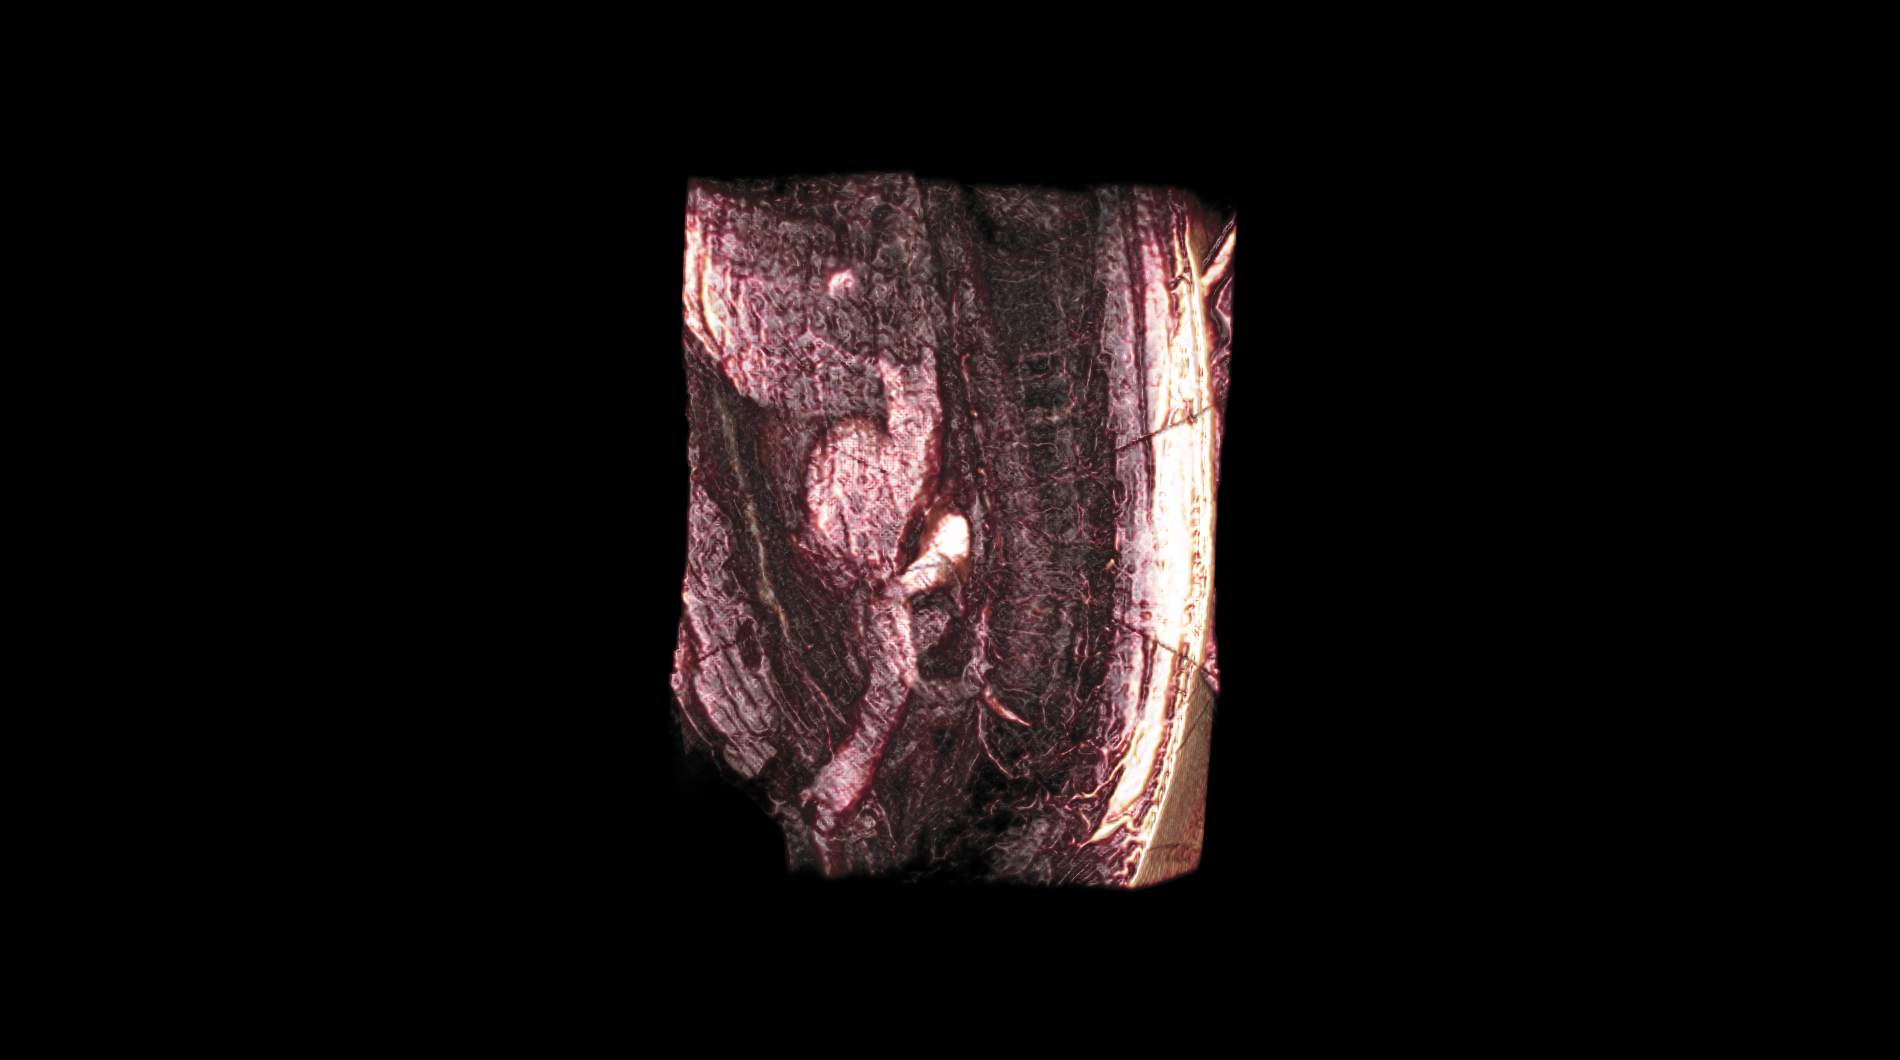
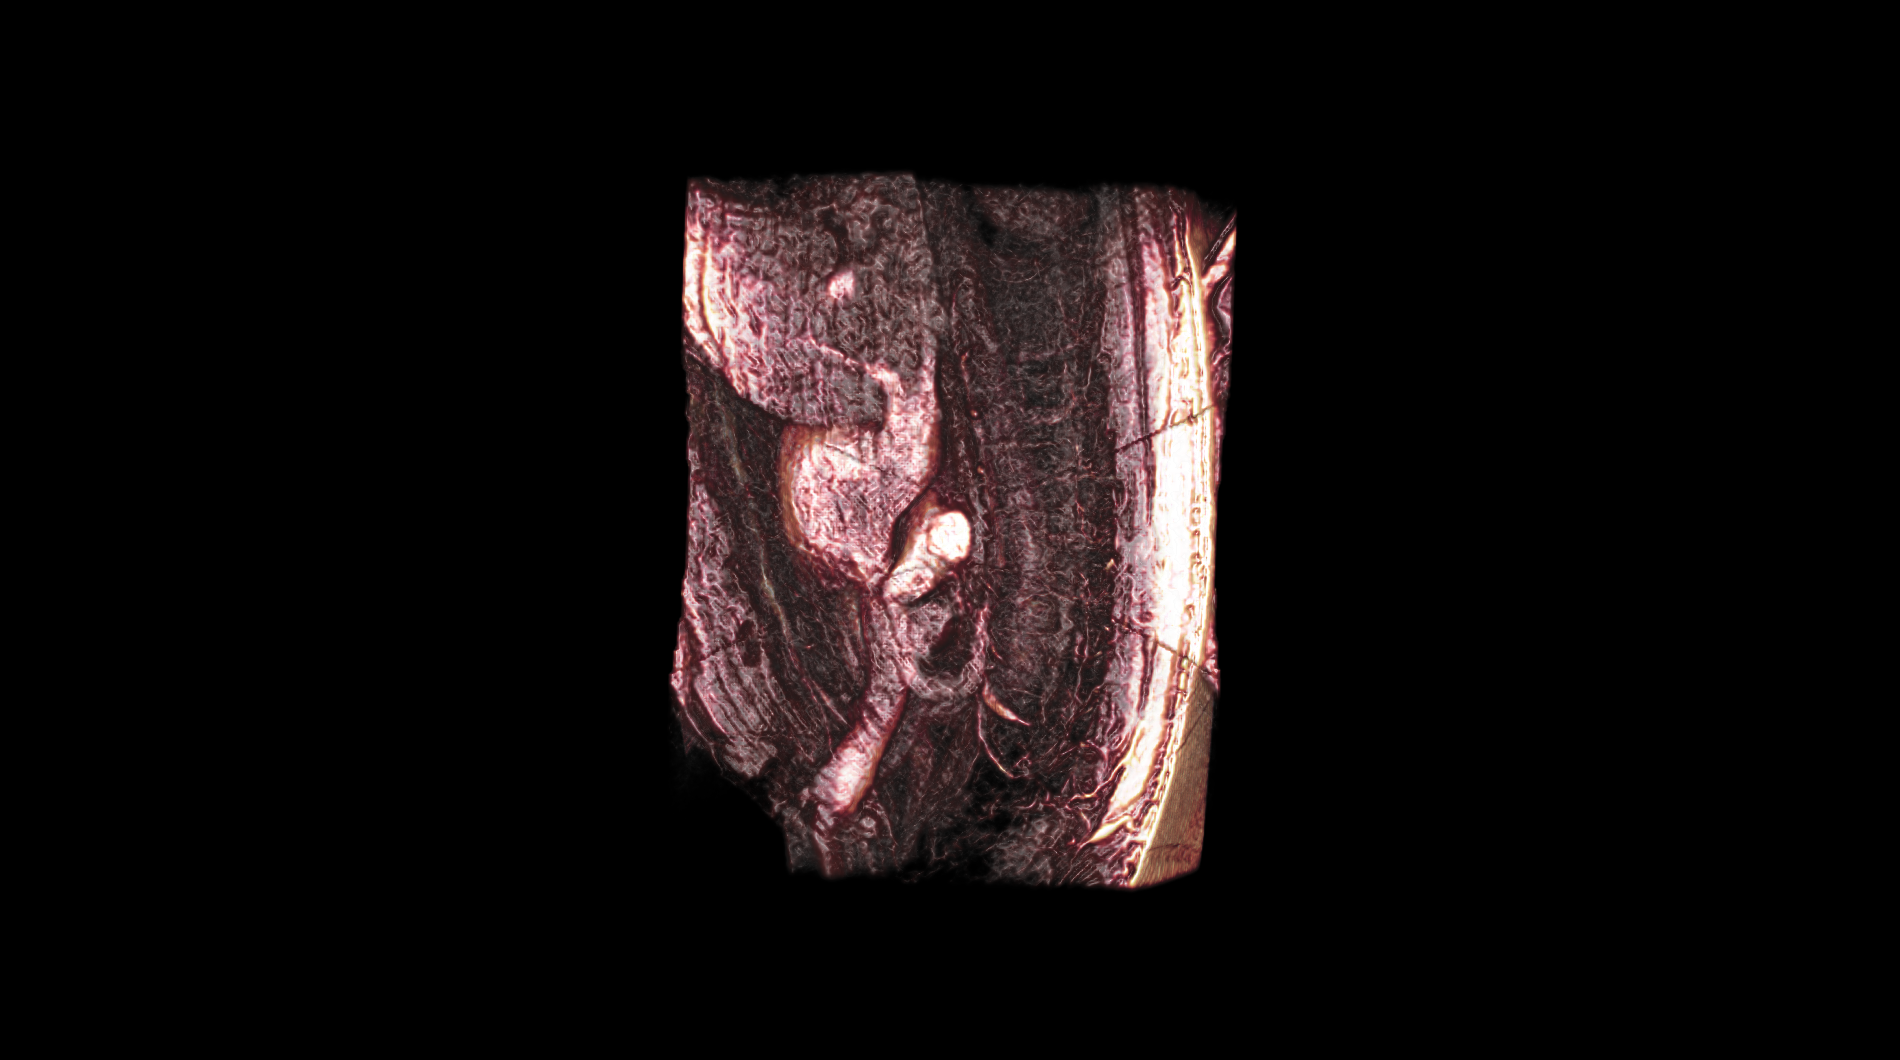
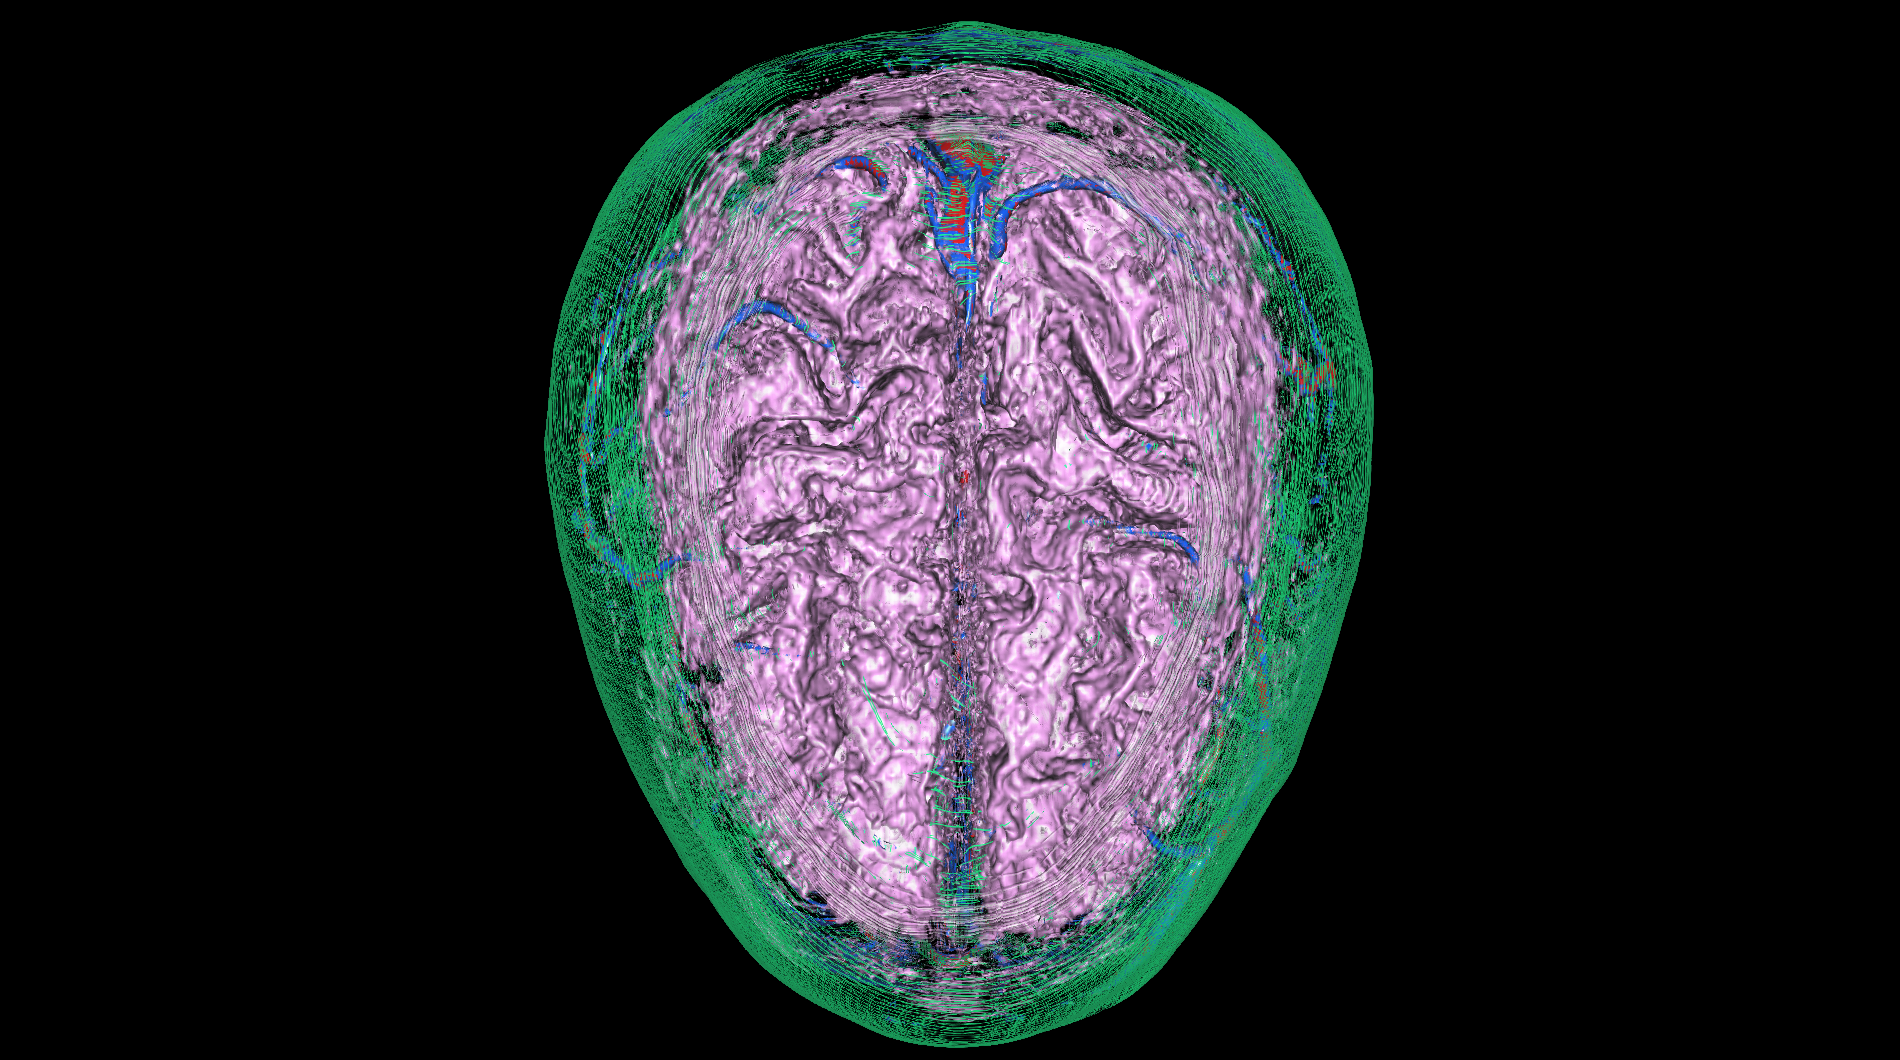
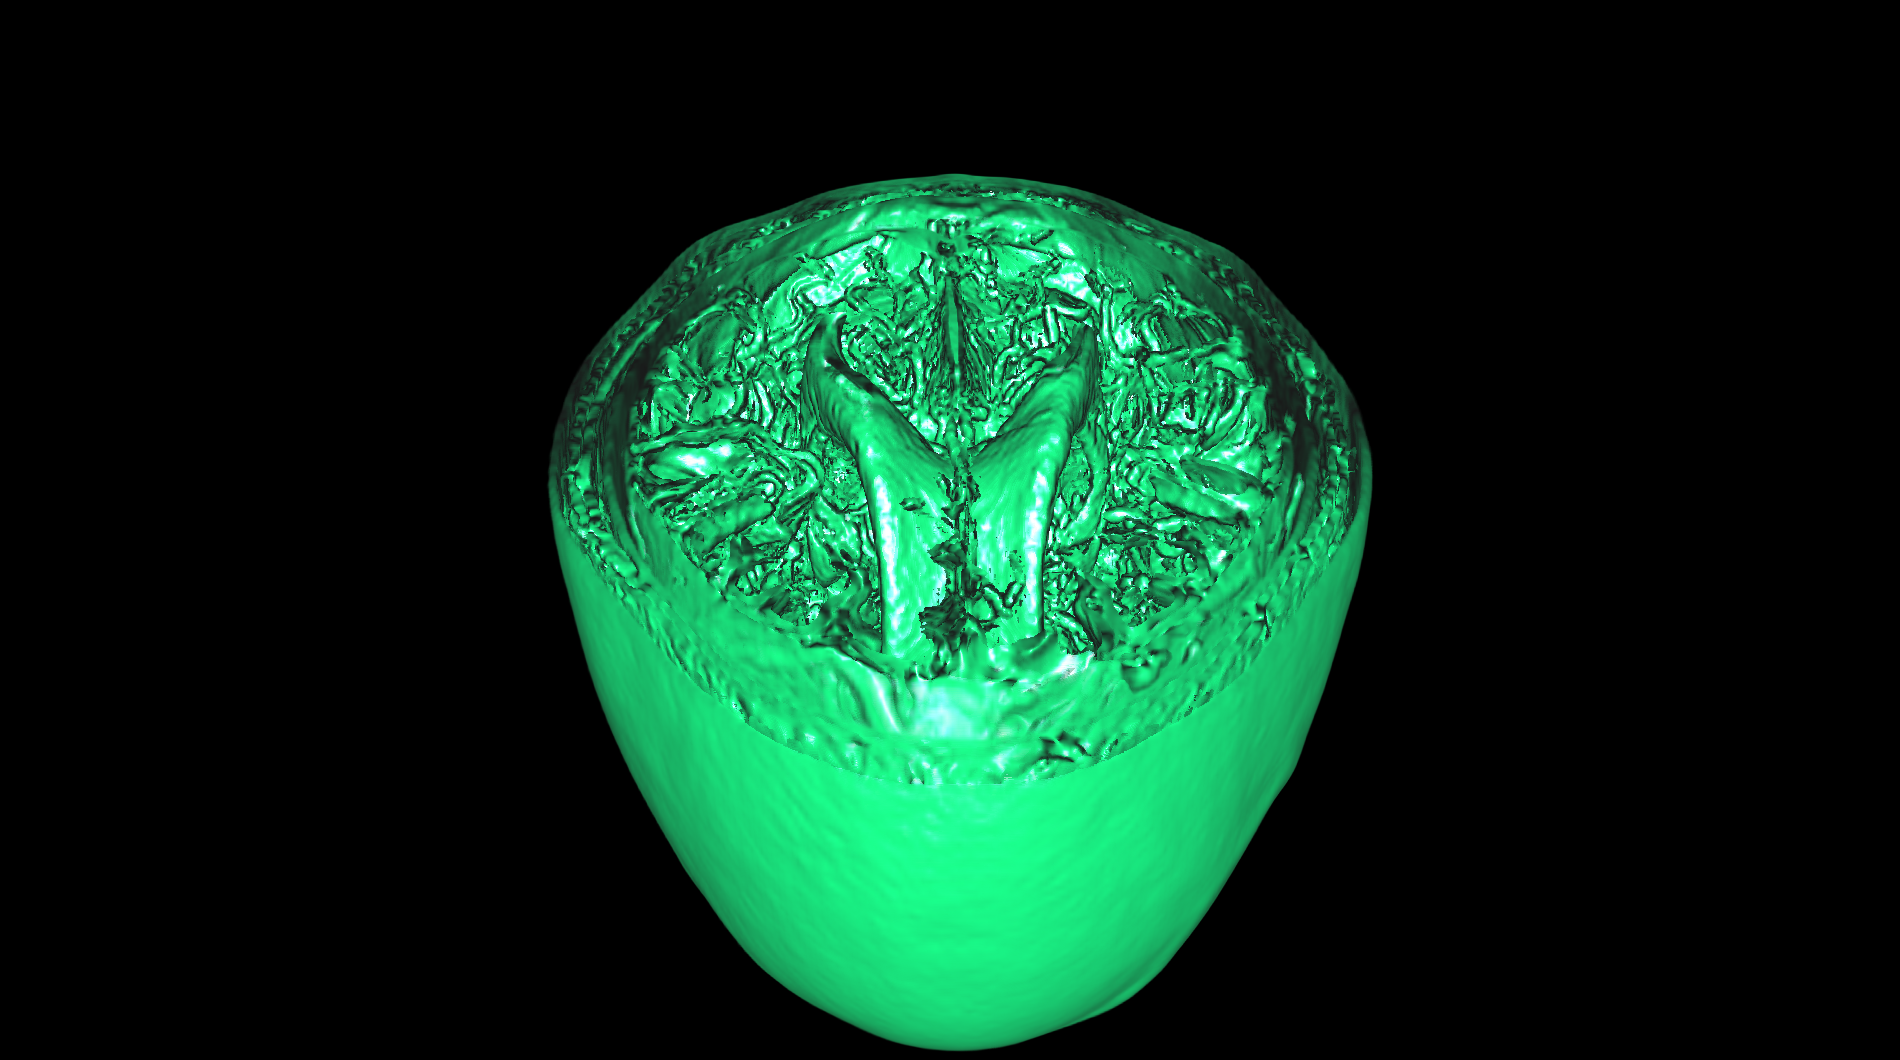
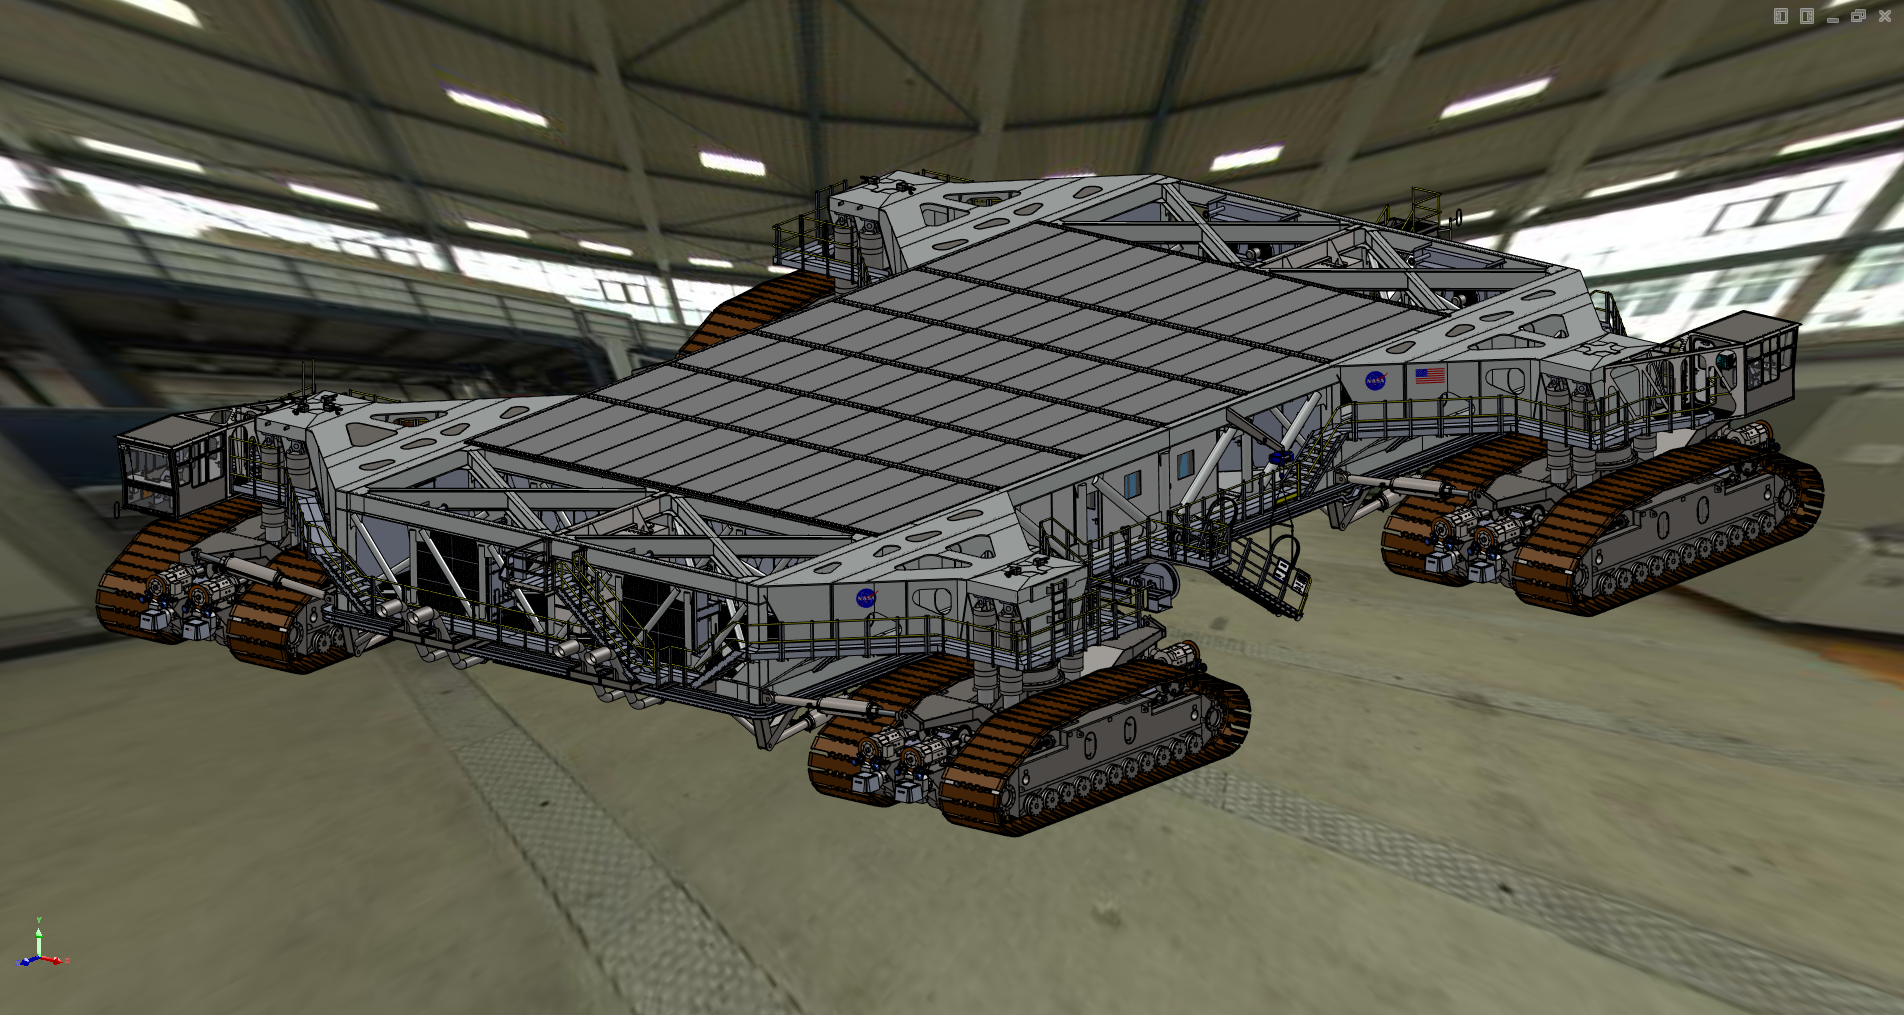
The medical-03 viewset demonstrates the performance of several medical visualization volume rendering techniques. The first is "slice rendering", where many 2D slices are projected through the volume and composited on the screen. The second is "raycasting" where rays are projected through the volume accumulating the final pixel color. Two different transfer functions are used: 1D, where the density is used to look up each voxel color, and 2D, where density and gradient magnitude are used to look up each voxel color. A clipping plane is used in several tests. The Tuvok visualization library is used for rendering.
medical-03 composite score: 91.47
The composite score is a weighted geometric mean of the subtest scores. See the table below for subtest weights and FPS scores for this run.
Subtest results
Click on each thumbnail image below to display the subtest's screen grab.
The results table above includes the details about each test within a viewset. Viewsets are often comprised of many tests which produce a frame rate. Frame rate is computed as the average Frames Per Second (FPS), or the total number of frames rendered divided by the time in seconds to render those frames. These FPS values are then used to compute the composite score using the weights for each test.
Screen Grabs Folder
Text Log File
XML Result File
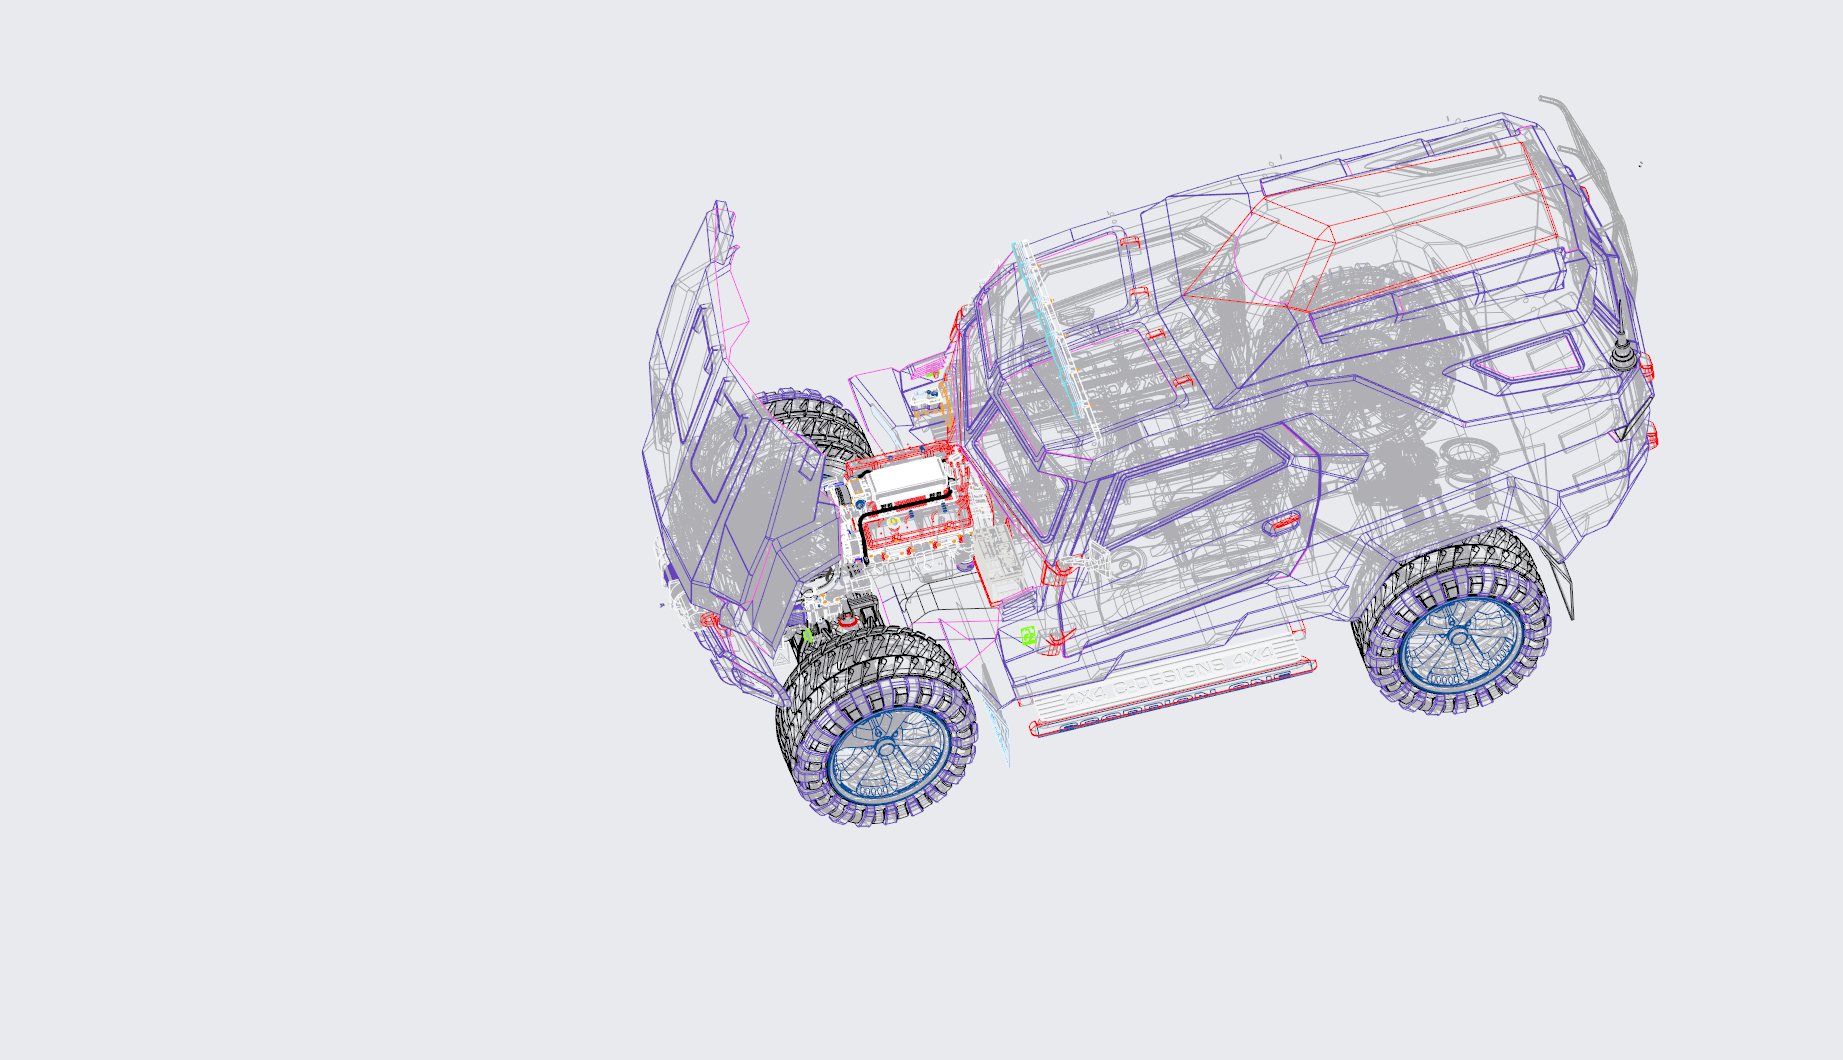
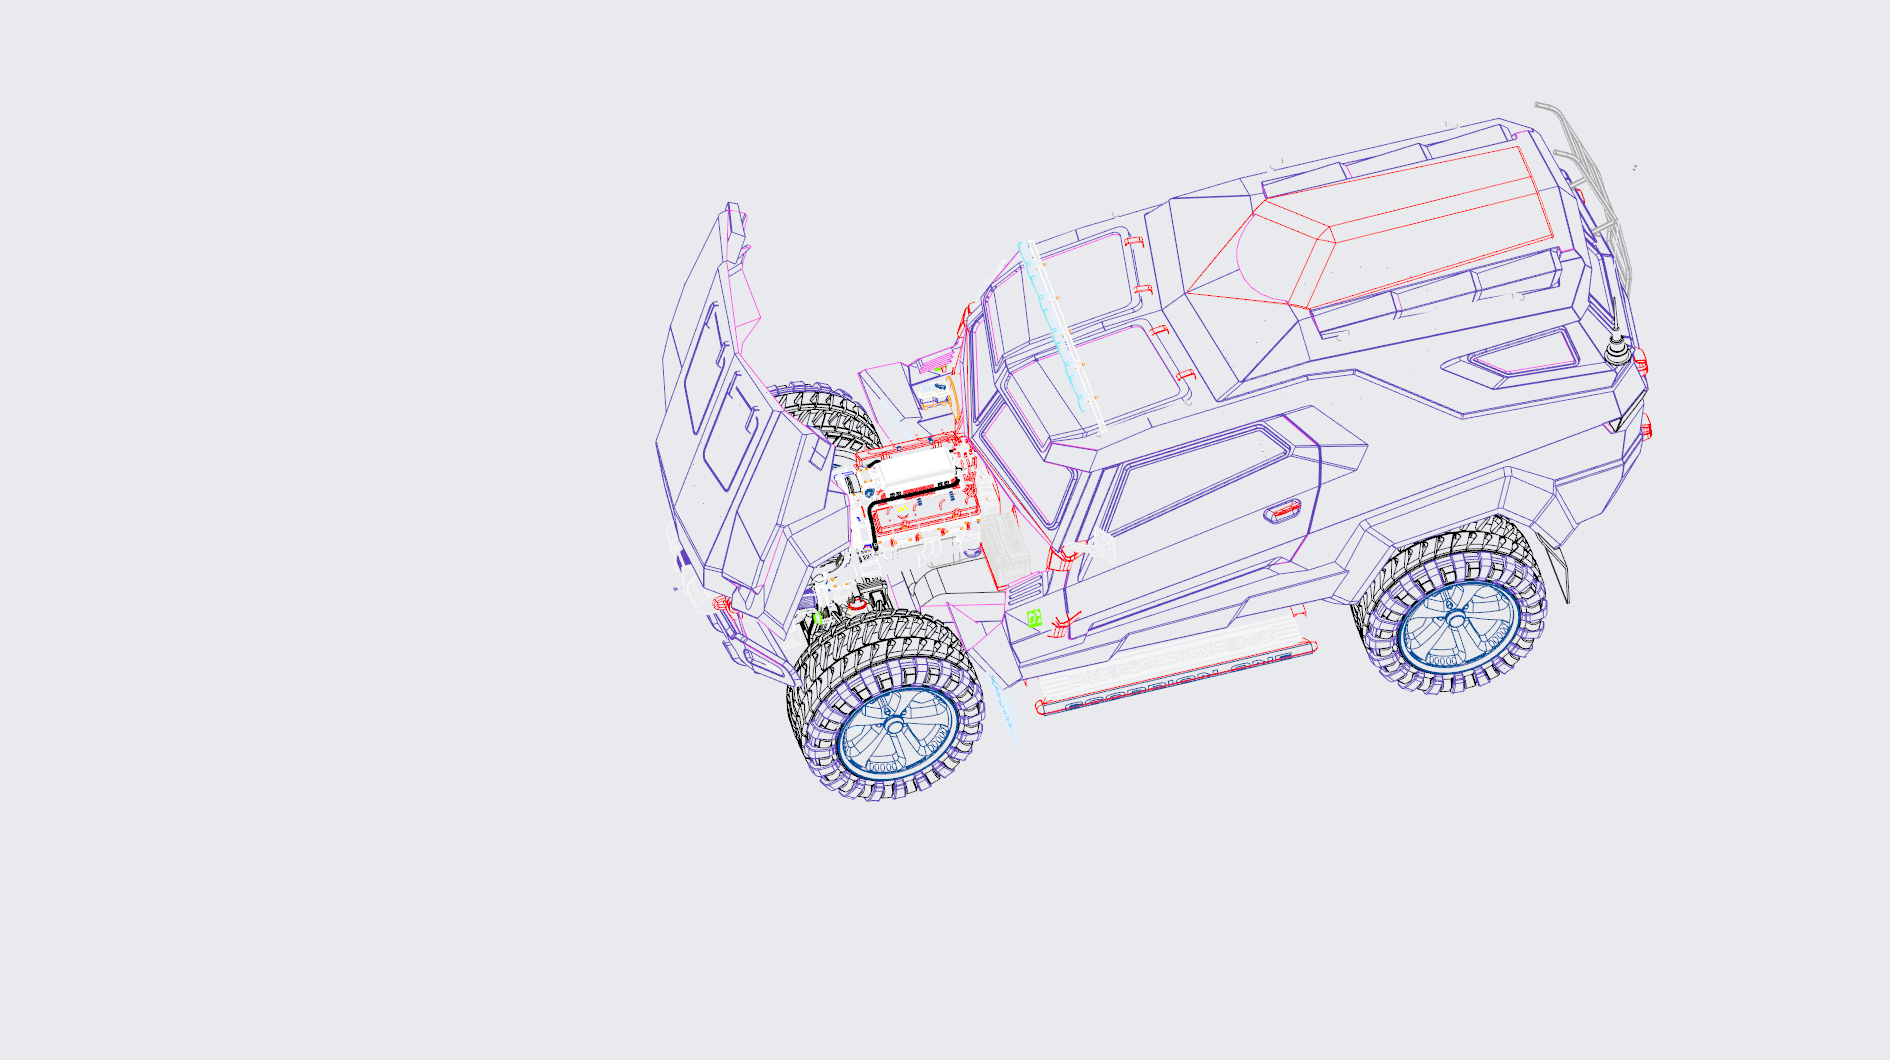
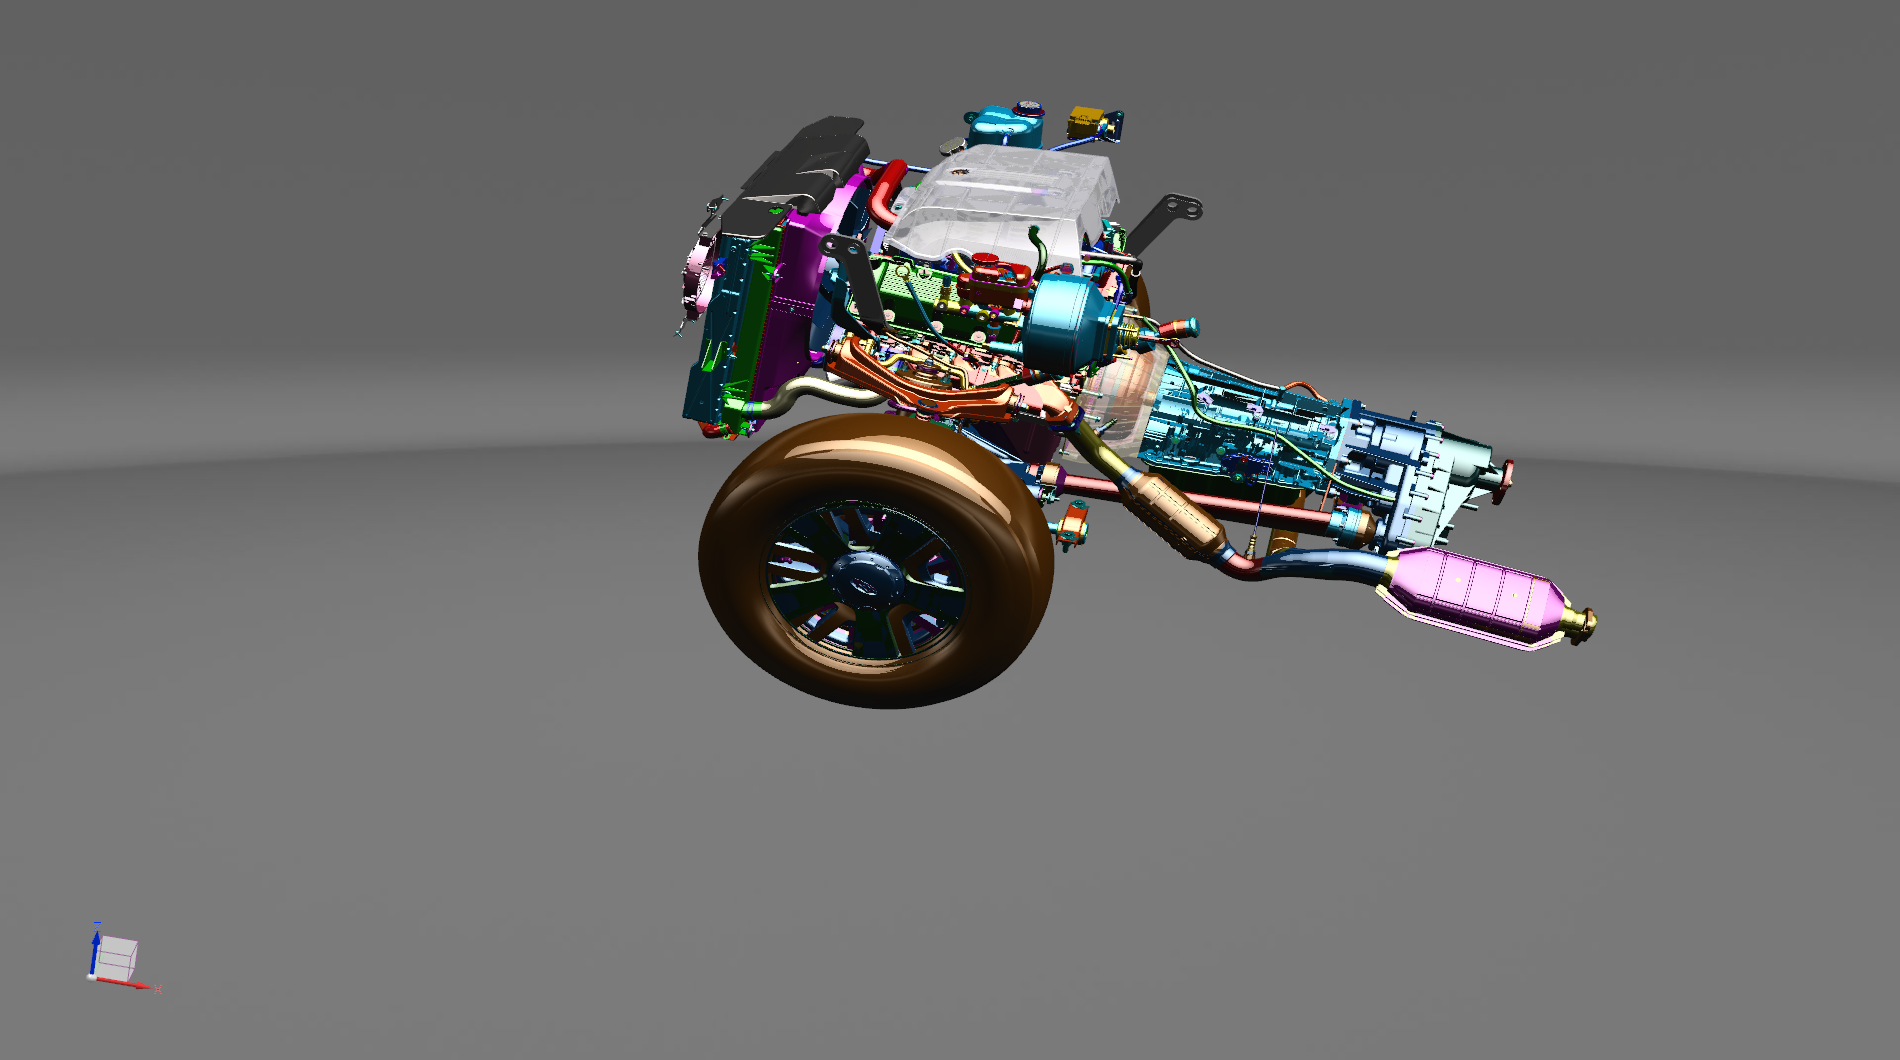
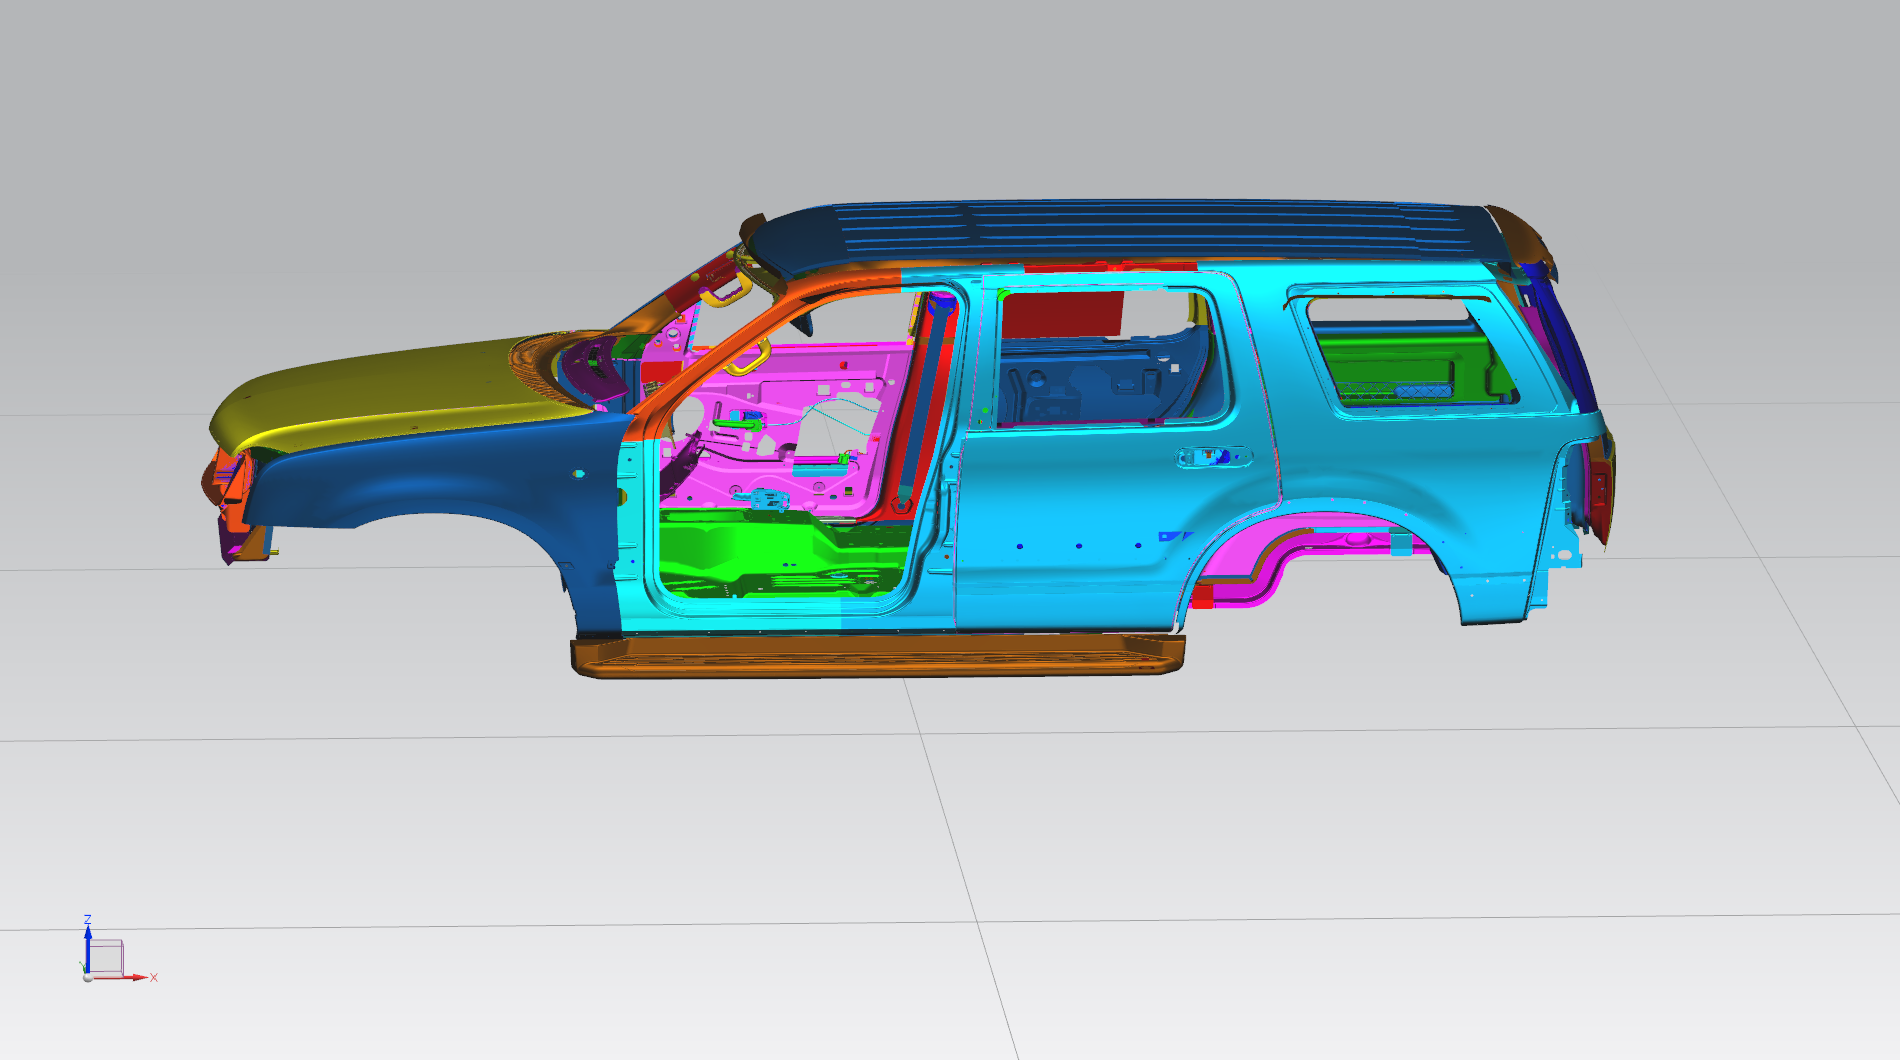
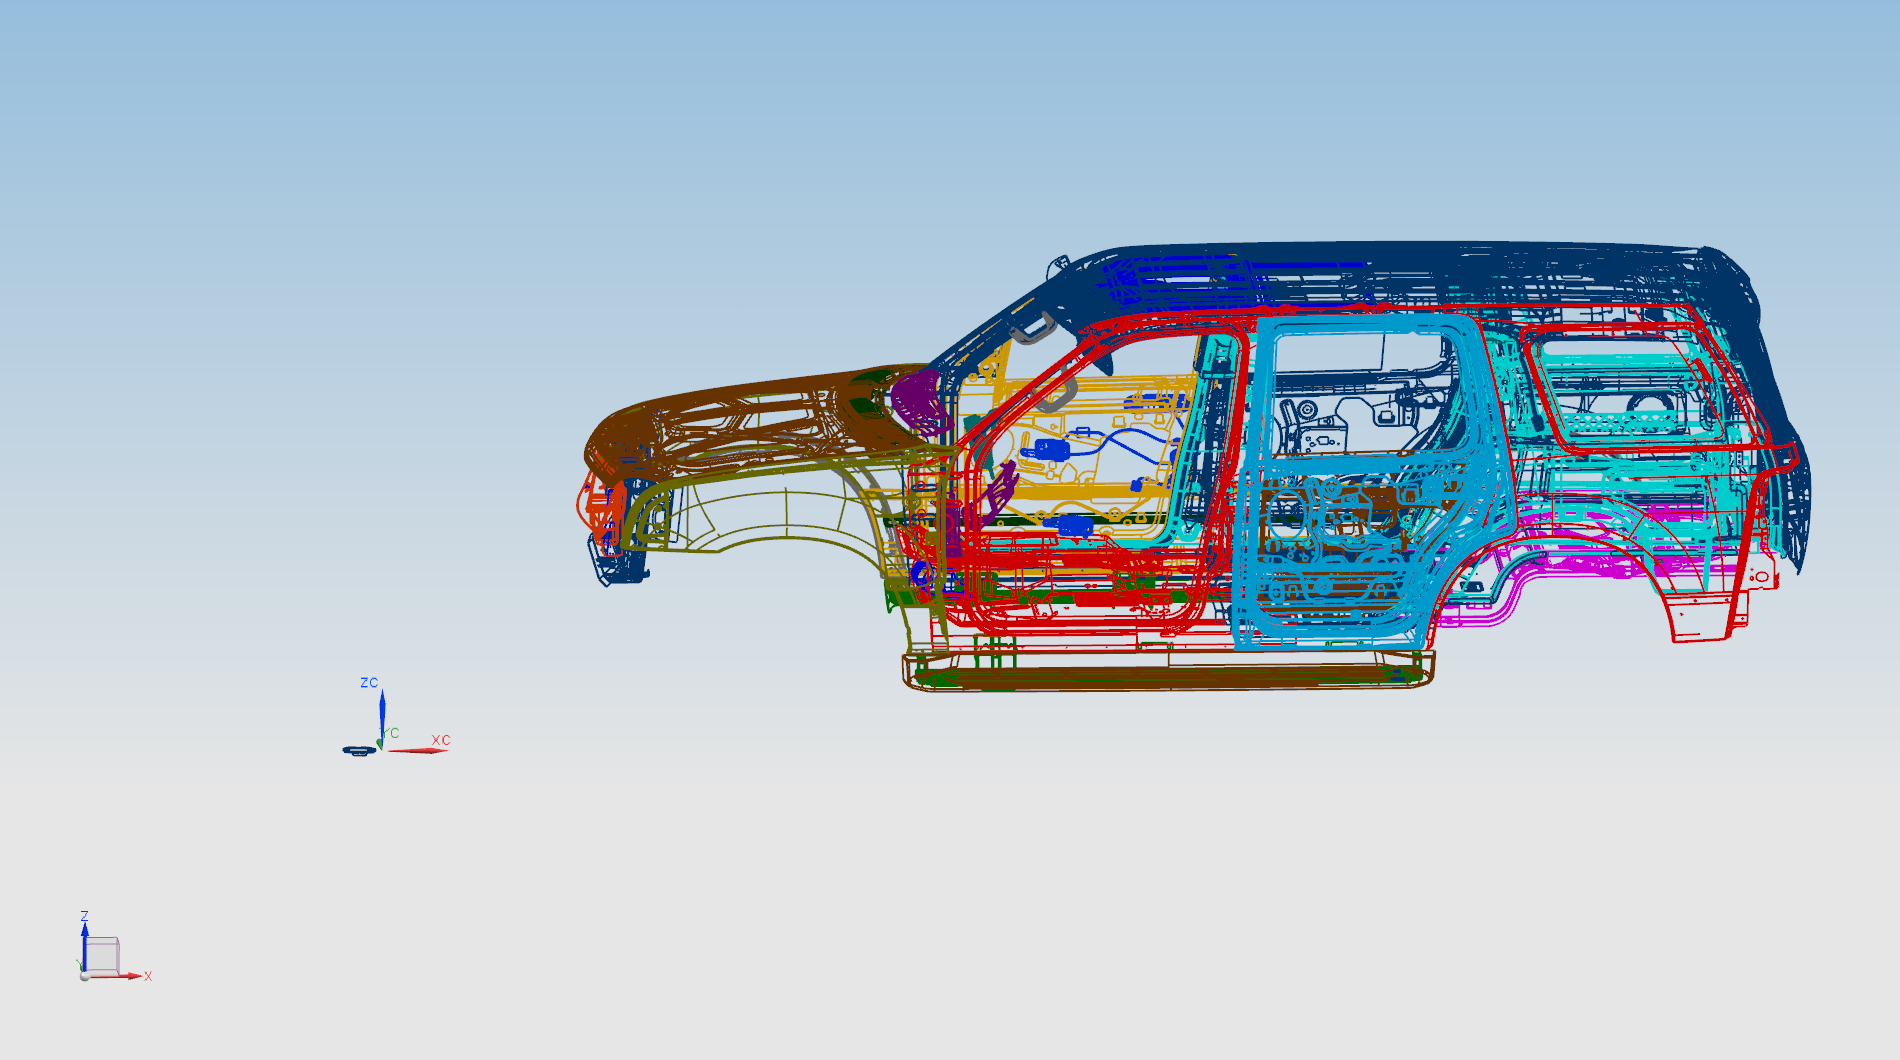
snx-04
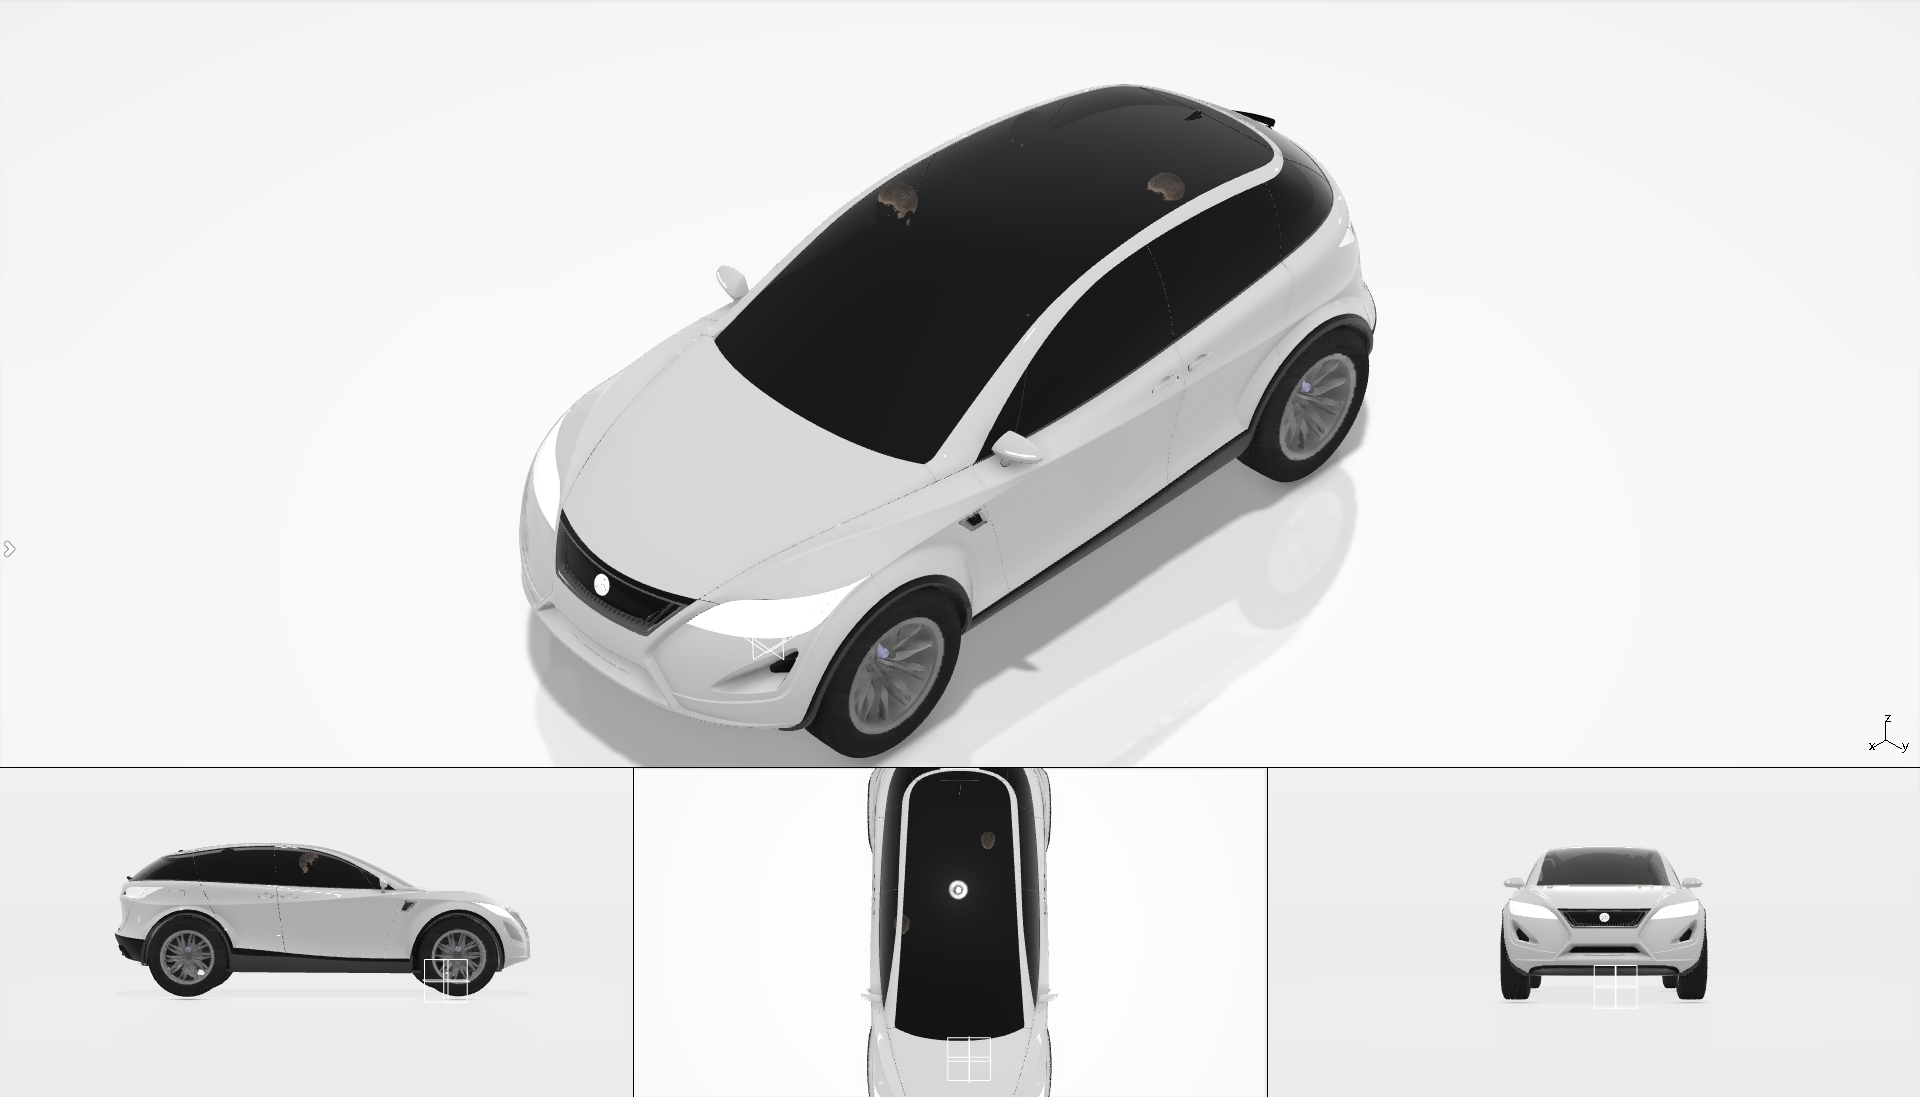
The snx-04 viewset was created from traces of the graphics workload generated by the NX 8.0 application from Siemens PLM. Model sizes range from 7.15 to 8.45 million vertices. The viewset includes numerous rendering modes supported by the application, including wireframe, anti-aliasing, shaded, shaded with edges, and studio mode.
snx-04 composite score: 613.02
The composite score is a weighted geometric mean of the subtest scores. See the table below for subtest weights and FPS scores for this run.
Subtest results
Click on each thumbnail image below to display the subtest's screen grab.
The results table above includes the details about each test within a viewset. Viewsets are often comprised of many tests which produce a frame rate. Frame rate is computed as the average Frames Per Second (FPS), or the total number of frames rendered divided by the time in seconds to render those frames. These FPS values are then used to compute the composite score using the weights for each test.
Screen Grabs Folder
Text Log File
XML Result File
solidworks-07
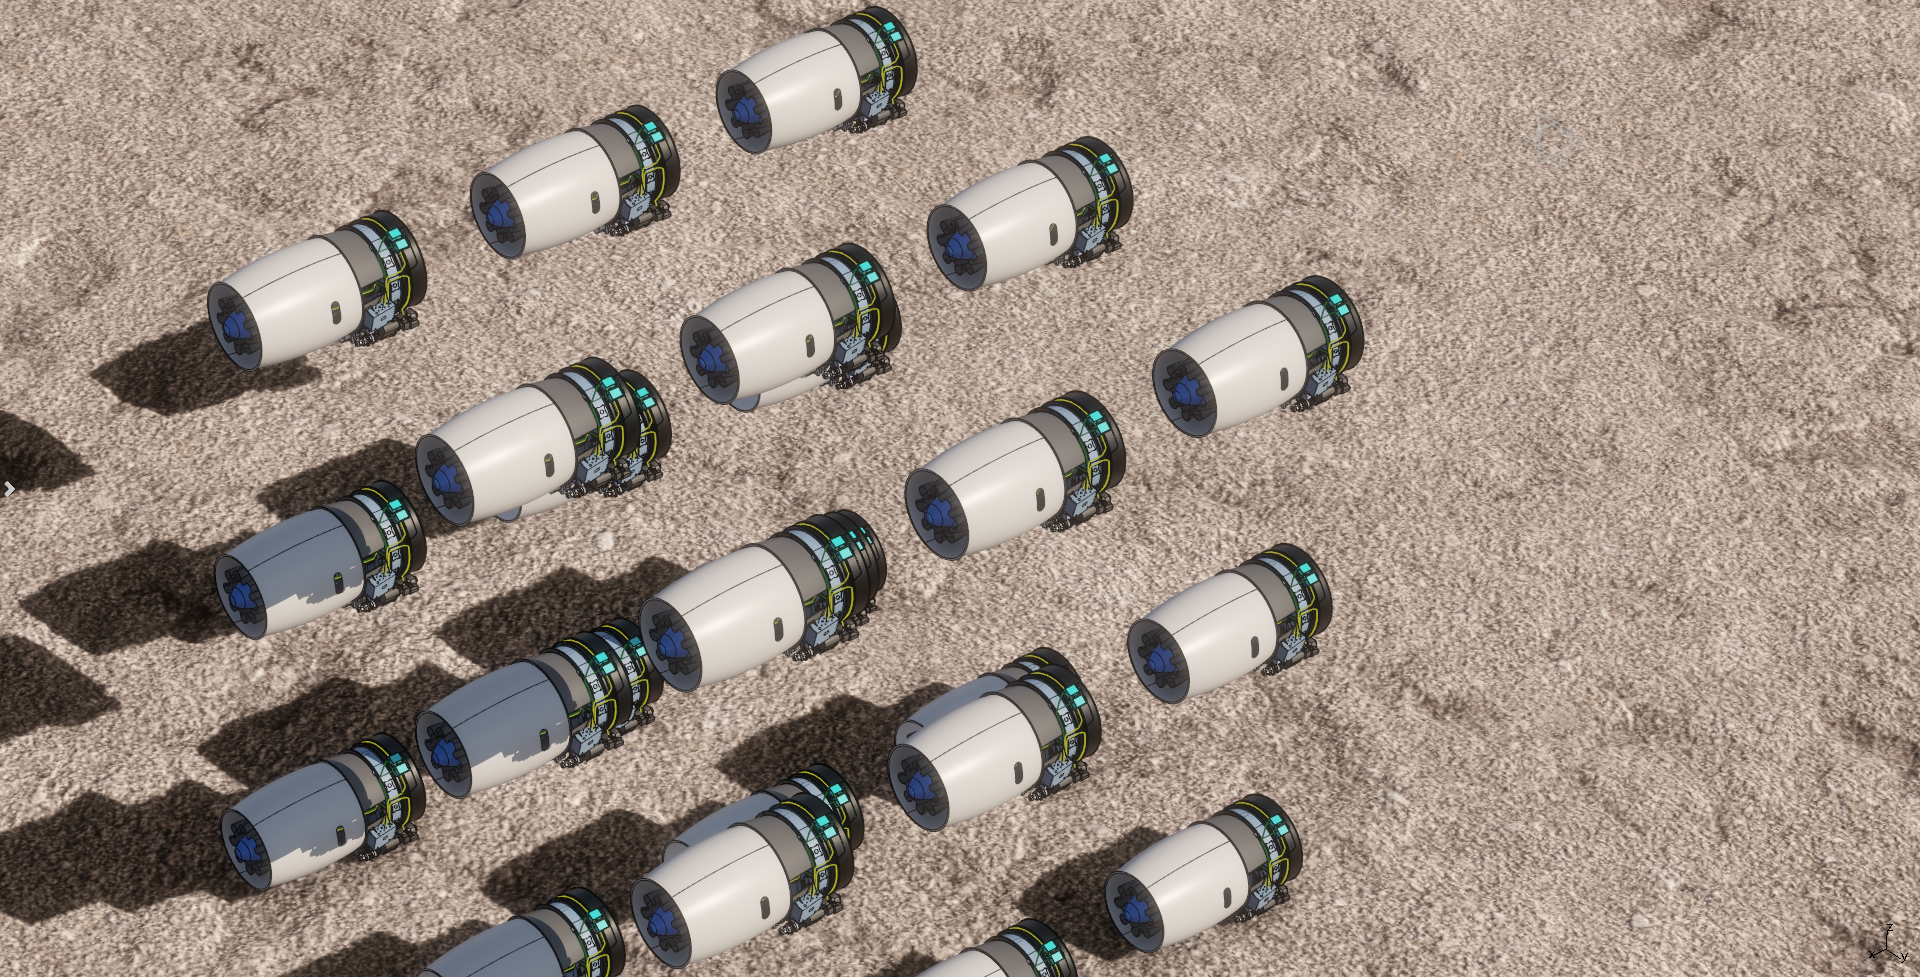
The solidworks-07 viewset was created from traces of Dassault Systèmes’ SolidWorks 2020 application. Models used in the viewset range in size from 2.1 to 21 million vertices. The viewset includes numerous rendering modes supported by the application, including shaded mode, shaded with edges, ambient occlusion, shaders, and environment maps. Note that this benchmark is not representative of Solidworks 2020 performance if less than 4GB of dedicated GPU memory is present, and should not be used to draw conclusions about Solidworks 2020 application performance with less than 4GB of video RAM.
solidworks-07 composite score: 372.63
The composite score is a weighted geometric mean of the subtest scores. See the table below for subtest weights and FPS scores for this run.
Subtest results
Click on each thumbnail image below to display the subtest's screen grab.
The results table above includes the details about each test within a viewset. Viewsets are often comprised of many tests which produce a frame rate. Frame rate is computed as the average Frames Per Second (FPS), or the total number of frames rendered divided by the time in seconds to render those frames. These FPS values are then used to compute the composite score using the weights for each test.
Screen Grabs Folder
Text Log File
XML Result File
